

Moving average line, counter-trend line, double bottom, and mBDSR signals
0
An indicator that shines in combination with RCI: BODSOR・mBDSR
Methods and Case Studies (PDF) ★GogoJungle AWARD 2020 Winner★
https://www.gogojungle.co.jp/tools/indicators/11836
283 PDF files are included.
Many of them are compiled as examples that logically link higher time frames and lower time frames by using three RCI lines, sequentially examining the状況 of multiple lower time frames, and ultimately waiting for pullbacks in lower time frames or selling rallies (i.e., mBDSR signals)..
Also,many emphasize catching points where multiple entry reasons overlap..
In the explanations,more than 1,000 chartsare used.

In recent Investment Navigator+ articles,we focus on examples that illustrate the strong compatibility between various trading methods and mBDSR signals..
USD/JPY 5-minute chart
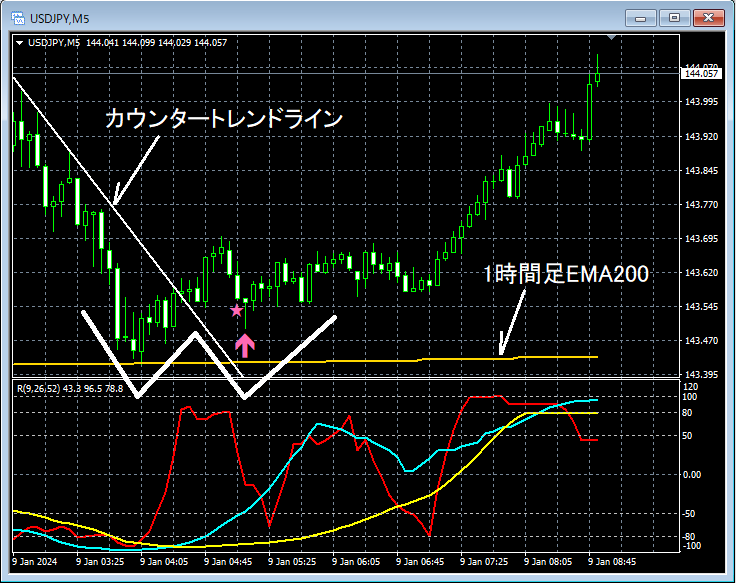
The higher-time-frame situation is omitted.
On the 5-minute chart above,price has fallen toward the EMA200 on the 1-hour chartand rebounded,and has broken above the counter-trend line.At the right side of the double bottomthemBDSR (RCI two-filter) pullback buy signallights up and rises.
From this example,there is clearly a high compatibility between trading methods that focus on moving averages, counter-trend lines, and double bottoms,andthe mBDSR signal..
An indicator that shines in combination with RCI: BODSOR・mBDSR
Methods and Case Studies (PDF) ★GogoJungle AWARD 2020 Winner★
https://www.gogojungle.co.jp/tools/indicators/11836
283 PDF files are included.
Many of them are compiled as examples that logically link higher time frames and lower time frames by using three RCI lines, sequentially examining the状況 of multiple lower time frames, and ultimately waiting for pullbacks in lower time frames or selling rallies (i.e., mBDSR signals)..
Also,many emphasize catching points where multiple entry reasons overlap..
In the explanations,more than 1,000 chartsare used.

× ![]()


