

Double top on the right peak of the lower timeframe's double top, mBDSR (RCI two-filter) sell signal on the pullback
Indicator that shines in combination with RCI: BODSOR・mBDSR
Method and Case Study (PDF) ★GogoJungle AWARD 2020 Winner★
https://www.gogojungle.co.jp/tools/indicators/11836
The PDF file includes 283 items.
Many of them are explained as examples that logically link higher and lower timeframes using three RCI lines, examining multiple lower timeframes sequentially, and ultimately waiting for a pullback buying opportunity or retracement selling timing (the mBDSR signal) on the lower timeframe..
In addition,there are many that focus on capturing points where multiple entry signals overlap..
In the explanations,more than 1,000 chartsare used.

In recent Investment Navi+ articles,the high compatibility between various trading methods and the mBDSR signals is showcasedthrough examples as the main focus.
EUR/GBP 15-minute chart
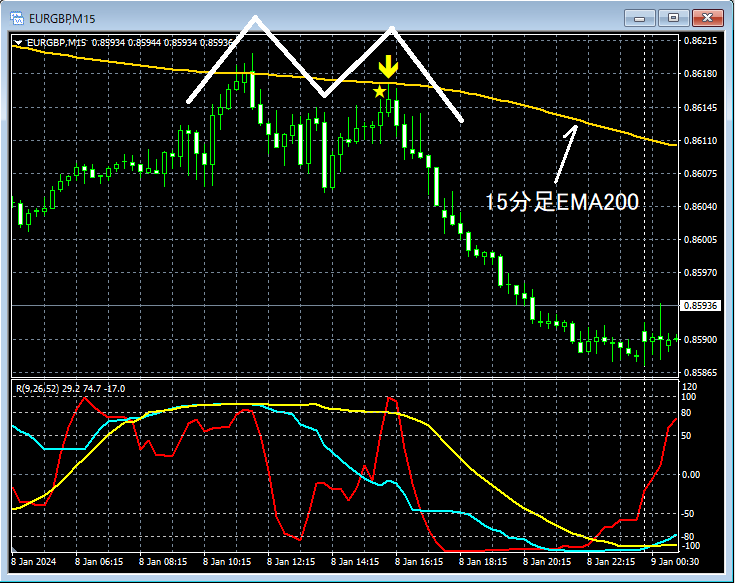
Looking at the 15-minute chart above,near the 200-period EMAthere is a pattern that could form adouble top, and on the right peak of thatdouble top, themBDSR (filters: RCI26 and RCI52) pullback selling signallights up, and the price is falling smoothly. Here, we will also look at the chart on lower timeframes after the signal lights up.
EUR/GBP 5-minute chart
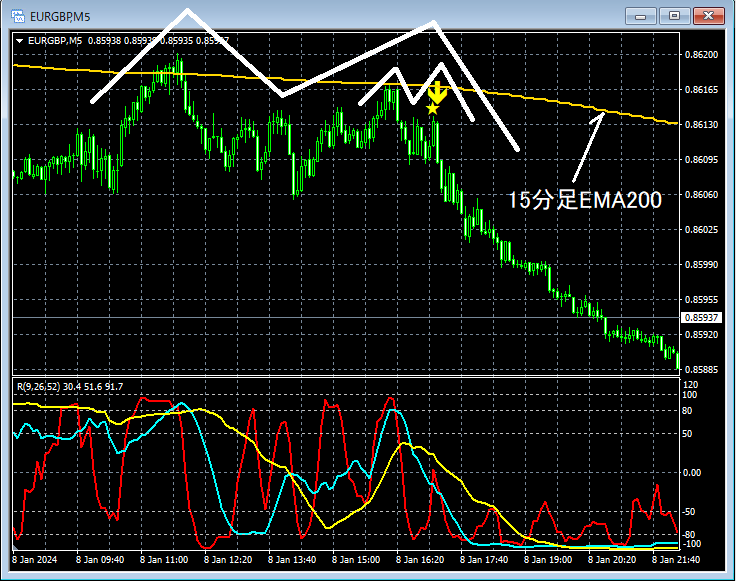
Looking at the 5-minute chart above,the right-side peak of the double topfurther forms anotherdouble top, and on the right peak of thatdouble topthelights up, and the price is falling smoothly.
From this example,andis evident.
Also, in this example,is used to achieve.
Indicator that shines in combination with RCI: BODSOR・mBDSR
Method and Case Study (PDF) ★GogoJungle AWARD 2020 Winner★
https://www.gogojungle.co.jp/tools/indicators/11836
The PDF file includes 283 items.
Many of them are explained as examples that logically link higher and lower timeframes using three RCI lines, examining multiple lower timeframes sequentially, and ultimately waiting for a pullback buying opportunity or retracement selling timing (the mBDSR signal) on the lower timeframe.
In addition,there are many that focus on capturing points where multiple entry signals overlap..
In the explanations,more than 1,000 chartsare used.

× ![]()


