

Today's USD/JPY chart (January 12, 2024): Moving averages, double bottom, and mBDSR (RCI two-filter) pullback buying signal
Indicator that delivers power in combination with RCI [BODSOR・mBDSR]
Methods and Case Studies (PDF) ★GogoJungle AWARD2020 winner★
https://www.gogojungle.co.jp/tools/indicators/11836
The PDF file includes 283 items.
Many of them are examples that have been distilled into a form that considers the situations of multiple lower timeframes by logically linking the higher and lower timeframes using three RCI lines, and ultimately waiting for the timing of buy-the-dips or sell-the-rallies on the lower timeframes (i.e., the mBDSR signal)..
Also,many focus on capturing points where multiple entry reasons coincide.
The explanations useover 1,000 charts.

In recent Investor Navigation+ articles,examples that illustrate the high compatibility between various trading methods and the mBDSR signalsare introduced mainly.
USD/JPY 5-minute chart
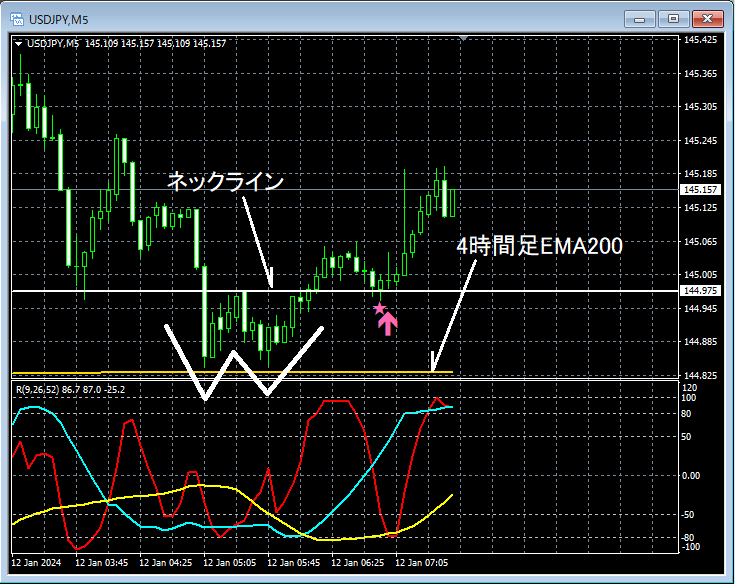
On the upper 5-minute chart,around the 200 EMA on the 4-hour chartadouble bottomforms and rebounds.The neckline of the double bottomhas fallen to the vicinity ofthe mBDSR (filter: RCI26 and RCI52) buy-the-dip signallights up, and subsequently, the price rises smoothly.
USD/JPY 1-minute chart
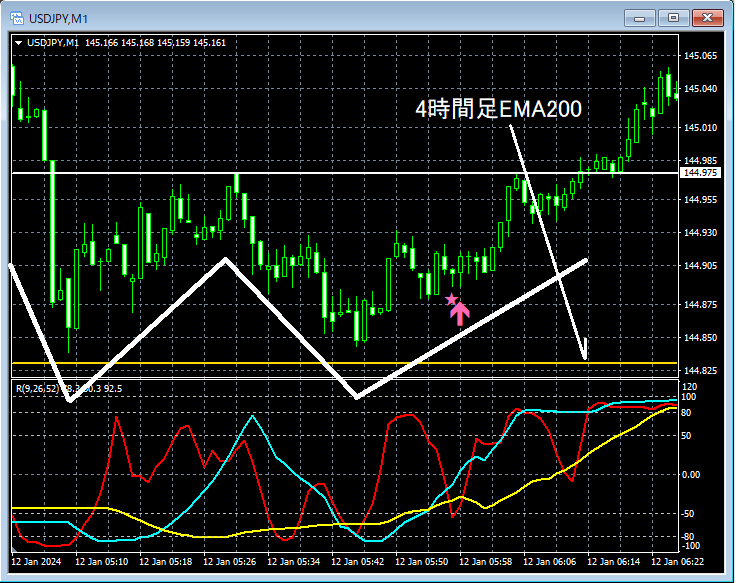
On the upper 1-minute chart, earlier timing than the 5-minute chart, i.e.,the right shoulder of the double bottomformsthe mBDSR (filter: RCI26 and RCI52) buy-the-dip signallights up, and subsequently, the price rises smoothly.
From this example,the high compatibility between a trading method that focuses on moving averages and double bottomsandthe mBDSR signalis evident.
Indicator that delivers power in combination with RCI【BODSOR・mBDSR】
Methods and Case Studies (PDF) ★GogoJungle AWARD2020 winner★
https://www.gogojungle.co.jp/tools/indicators/11836
The PDF file includes 283 items.
Many of them are examples that have been distilled into a form that considers the situations of multiple lower timeframes by logically linking the higher and lower timeframes using three RCI lines, and ultimately waiting for the timing of buy-the-dips or sell-the-rallies on the lower timeframes (i.e., the mBDSR signal).
Also,many focus on capturing points where multiple entry reasons coincide.
The explanations useover 1,000 charts.

× ![]()


