

Today's USD/JPY chart (January 11, 2024): Signals of head-and-shoulders on higher timeframes, RCI with three lines, and mBDSR (RCI two-line filter)
0
Indicator that shines in combination with RCI【BODSOR・mBDSR】
Methods and Case Studies (PDF) ★GogoJungle AWARD2020 winner★
https://www.gogojungle.co.jp/tools/indicators/11836
A PDF file of 283 items is attached.
Many of them are examples that have been organized to logically link higher and lower timeframes using the three-RCI lines, examining the状況 of multiple lower timeframes in sequence, and ultimately waiting for a pullback buying or pullback selling timing on the lower timeframe (the mBDSR signal)..
In addition,there are many that focus on capturing points where multiple entry reasons overlapas well.
The explanation usesmore than 1,000 charts.

In recent Investor Navigation+ articles,examples that show the high compatibility between various trading methods and mBDSR signalsare introduced focusing on such cases.
USD/JPY 30-minute chart
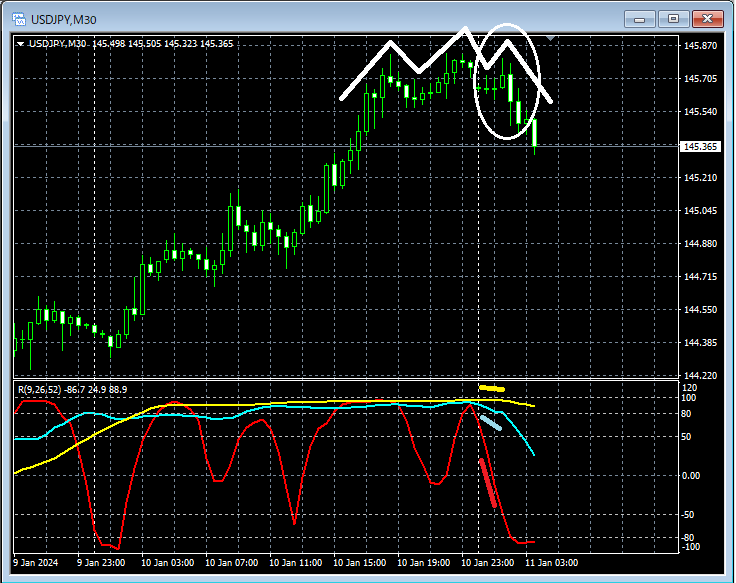
On the upper 30-minute chart,the right shoulder of the head and shouldersis already formingthe three-RCI lines align and decline, showing a very weak pattern. It may be reasonable to consider a pullback sell on the lower timeframe.
USD/JPY 1-minute chart
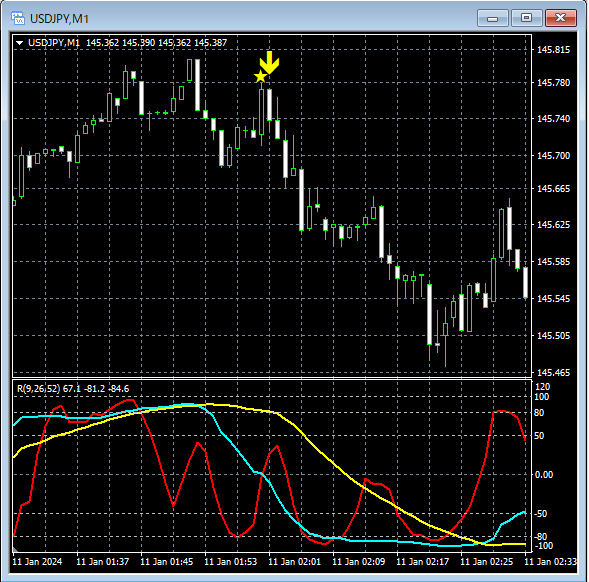
On the 30-minute chartthe right shoulderis forming, and on the upper 1-minute chartmBDSR (filter: RCI26 and RCI52) pullback sell signallights up, and subsequently, the price declines smoothly.
From this example,the high synergy between trade methods that focus on the RCI three lines and the head-and-shoulders patternandthe mBDSR signalis evident.
Also, in this example,placing a stop loss just above the recent highis used,enabling high risk-reward trades.
Indicator that shines in combination with RCI【BODSOR・mBDSR】
Methods and Case Studies (PDF) ★GogoJungle AWARD2020 winner★
https://www.gogojungle.co.jp/tools/indicators/11836
A PDF file of 283 items is attached.
Many of them are examples that have been organized to logically link higher and lower timeframes using the three-RCI lines, examining the状況 of multiple lower timeframes in sequence, and ultimately waiting for a pullback buying or pullback selling timing on the lower timeframe (the mBDSR signal).
In addition,there are many that focus on capturing points where multiple entry reasons overlapas well.
The explanation usesmore than 1,000 charts.

× ![]()


