

Daily chart EMA21, 4-hour EMA21, and 1-hour EMA21, plus mBDSR (RCI2-filter) pullback buy signal
Indicator that shines in combination with RCI: BODSOR・mBDSR
Methods and Case Studies (PDF) ★GogoJungle AWARD2020 Winner★
https://www.gogojungle.co.jp/tools/indicators/11836
The PDF file includes 283 items.
Many of them are examples that lay out a form where multiple lower timeframes are logically linked using three RCI lines to sequentially analyze the situations of the higher and lower timeframes, and ultimately wait for a timing of a pullback buy or a pullback sell on the lower timeframes (i.e., the mBDSR signal)..
Also,there are many that focus on catching points where multiple entry reasons coincide.
In the explanations,more than 1,000 chartsare used.

In recent Investor Navi+ articles,the high compatibility between various trading methods and mBDSR signals is shown with examples.We focus on examples that illustrate this.
NZDJPY 30-minute chart
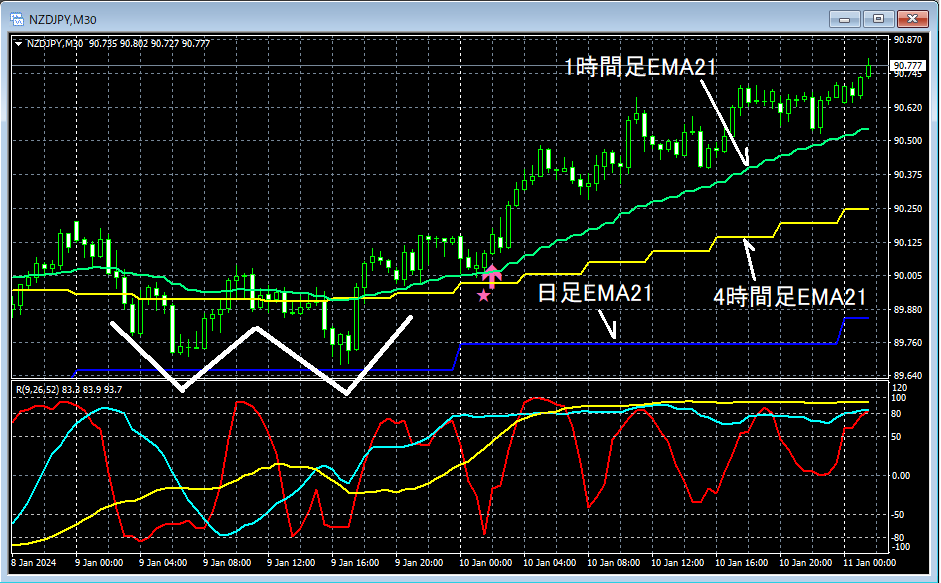
The higher timeframe status is omitted. On the upper 30-minute chart,close to the Daily EMA21there isa double bottomand a rebound.The 4-hour EMA21andthe 1-hour EMA21are broken to the upside. Then,andoverlap,and prices thereafter rise.
From this example,andis evident.
Indicator that shines in combination with RCI: BODSOR・mBDSR
Methods and Case Studies (PDF) ★GogoJungle AWARD2020 Winner★
https://www.gogojungle.co.jp/tools/indicators/11836
The PDF file includes 283 items.
Many of them are examples that lay out a form where multiple lower timeframes are logically linked using three RCI lines to sequentially analyze the situations of the higher and lower timeframes, and ultimately wait for a timing of a pullback buy or a pullback sell on the lower timeframes (i.e., the mBDSR signal)..
Also,there are many that focus on catching points where multiple entry reasons coincide.
In the explanations,more than 1,000 chartsare used.

× ![]()


