

Return signal for RCI3 single line with moving average, head and shoulders, and mBDSR (RCI2 full-filter) overbought/short signal
0
An indicator that shines in combination with RCI: 【BODSOR・mBDSR】
Method and case studies (PDF) ★GogoJungle AWARD 2020 winner★
https://www.gogojungle.co.jp/tools/indicators/11836
The PDF file includes 283 items.
Most of them are examples that lay out how to logically link higher and lower timeframes using three RCI lines, sequentially examine the状況 of multiple lower timeframes, and finally wait for pullback buying or pullback selling signals on the lower timeframe (i.e., mBDSR sign).
Also,many focus on capturing points where multiple entry reasons overlapas well.
In the explanations,more than 1,000 chartsare used.

In a recent Investor Navi+ article,the high compatibility between various trading methods and the mBDSR signals is highlightedwith examples centered on this.
AUDCHF Daily
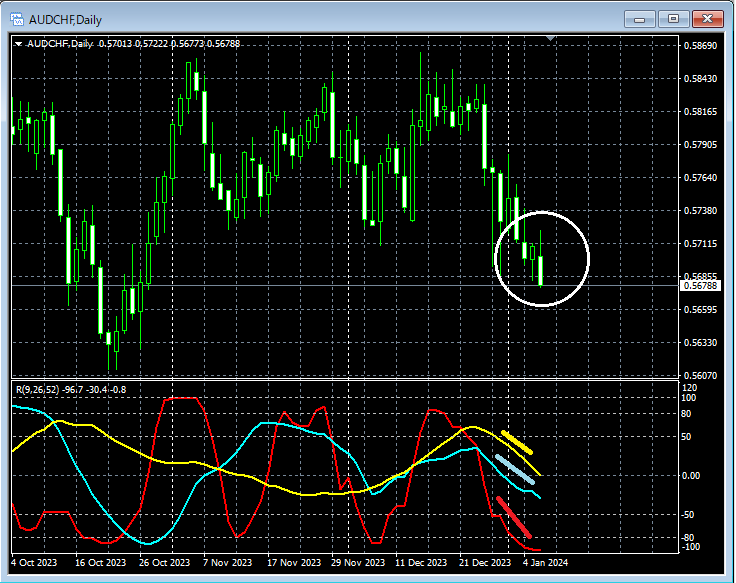
If you look at the area circled in white on the higher timeframe,the three RCI lines align and move down in a weak formation(close to a condition). It might not be strange to consider selling on the pullback on the lower timeframe.
AUDCHF 15-minute
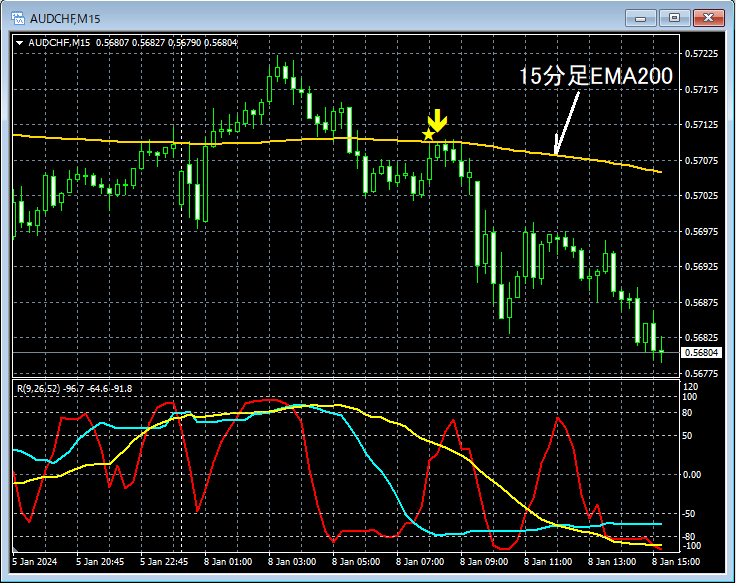
On the higher 15-minute chart,the 15-minute EMA200is broken, and thenthe price rises toward the vicinity of the 15-minute EMA200,mBDSR (filter: RCI26 and RCI52) pullback selling signallights up, and thereafter the price declines smoothly.
AUDCHF 5-minute
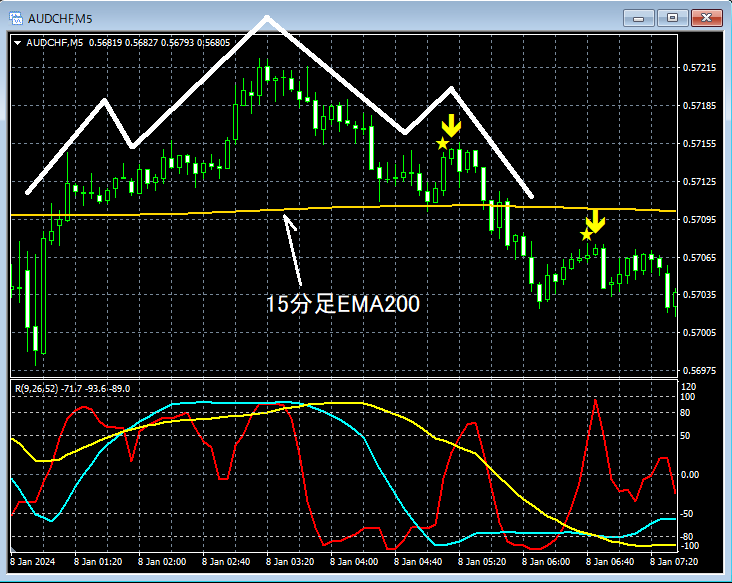
Also, on the above 5-minute chart, before the 15-minute signal lights up, aHead and Shoulders pattern forms, and at theright shoulder of the head and shoulders, themBDSR (filter: RCI26 and RCI52) pullback selling signal lights up, and subsequently the price declines smoothly. Note that,on the pullback after breaking the 15-minute EMA200, there is anothermBDSR (filter: RCI26 and RCI52) pullback selling signal that lights up.
From this example,it is evident that there is a high compatibility between trading methods that focus on RCI three-line, moving averages, and head-and-shoulders, and the signals of mBDSR.
Indicator that shines in combination with RCI: 【BODSOR・mBDSR】
Method and case studies (PDF) ★GogoJungle AWARD 2020 winner★
https://www.gogojungle.co.jp/tools/indicators/11836
The PDF file includes 283 items.
Most of them are examples that lay out how to logically link higher and lower timeframes using three RCI lines, sequentially examine the状況 of multiple lower timeframes, and finally wait for pullback buying or pullback selling signals on the lower timeframe (i.e., mBDSR sign).
Also,many focus on capturing points where multiple entry reasons overlapas well.
In the explanations,more than 1,000 chartsare used.

× ![]()


