

RCI3 main line and pullback high and return move and mBDSR (RCI2-line filter) buy signal
0
An indicator that shows great power when combined with RCI【BODSOR・mBDSR】
Methods and Case Studies (PDF) ★GogoJungle AWARD2020 winner★
https://www.gogojungle.co.jp/tools/indicators/11836
The included PDF files are 283 in total.
Many of them are examples that have been distilled into a form that logically links higher and lower timeframes by using three RCI lines, sequentially examining the conditions of multiple lower timeframes, and ultimately waiting for the timing of buy-the-dips or sell-the-rebounds on the lower timeframes (i.e., the mBDSR signal)..
Also,many focus on identifying points where multiple entry reasons overlap.
In the explanations,over 1,000 charts are used.

In recent Investor Navigation+ articles,examples that demonstrate the strong compatibility between various trading methods and mBDSR signalsare highlighted.
EURAAUD 4-hour chart
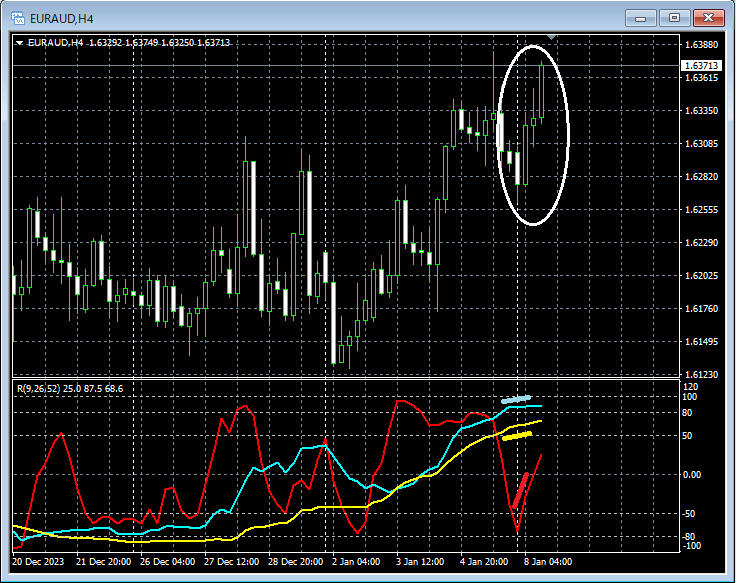
Looking at the area circled in white on the above 4-hour chart,the three RCI lines align and risecreating a very strong setup, making it plausible to consider a dip-buy on the lower timeframe.
EURAAUD 15-minute chart
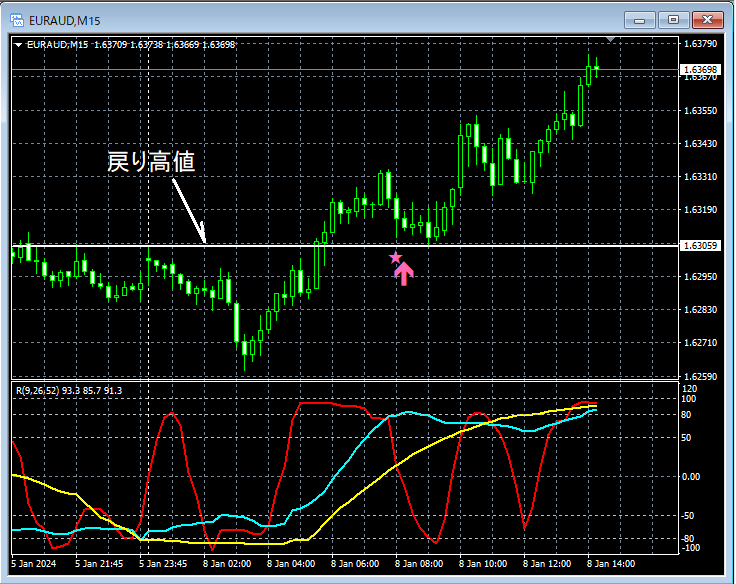
On the 15-minute chart above,a breakout above the return highis followed by areturn movethat pulls back toward thereturn higharea,where the mBDSR (filter: RCI26 and RCI52) dip-buy signallights up, and price subsequently moves higher.
From this example,the high compatibility between RCI three-line setups, return highs, and return moves as a trading methodandthe mBDSR signalis evident.
An indicator that shines when combined with RCI【BODSOR・mBDSR】
Methods and Case Studies (PDF) ★GogoJungle AWARD2020 winner★
https://www.gogojungle.co.jp/tools/indicators/11836
The included PDF files are 283 in total.
Many of them are examples that have been distilled into a form that logically links higher and lower timeframes by using three RCI lines, sequentially examining the conditions of multiple lower timeframes, and ultimately waiting for the timing of buy-the-dips or sell-the-rebounds on the lower timeframes (i.e., the mBDSR signal).
Also,many focus on identifying points where multiple entry reasons overlap.
In the explanations,over 1,000 charts are used.

× ![]()


