

Support line on the higher timeframe, noticeable lows, and the return-sell signal of mBDSR (RCI2 dual-filter)
0
Indicator that delivers power in combination with RCI【BODSOR・mBDSR】
Methods・Case Studies (PDF) ★GogoJungle AWARD 2020 Winner★
https://www.gogojungle.co.jp/tools/indicators/11836
The PDF file includes 283 items.
Many of them are examples that analyze multiple lower-timeframe conditions by logically linking higher and lower timeframes using three RCI lines, and ultimately waiting for the timing to buy on dips or sell on rallies on the lower timeframe (i.e., the mBDSR signal)..
Also,many emphasize catching points where multiple entry reasons coincide.
In the explanations,more than 1,000 chartsare used.

In recent Investor Navi+ articles,you can see examples that illustrate the high compatibility between various trading methods and the mBDSR signal.
EURJPY 1-hour chart
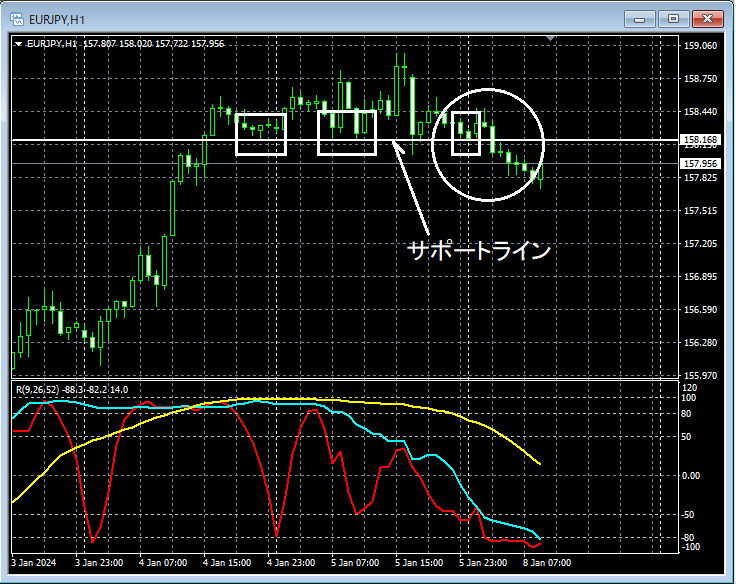
Looking at the area circled in white on the 1-hour timeframe above,a support line is briefly breached, then the price rises again near that line. It may not be unusual to expect a slight further drop.
EURJPY 5-minute chart
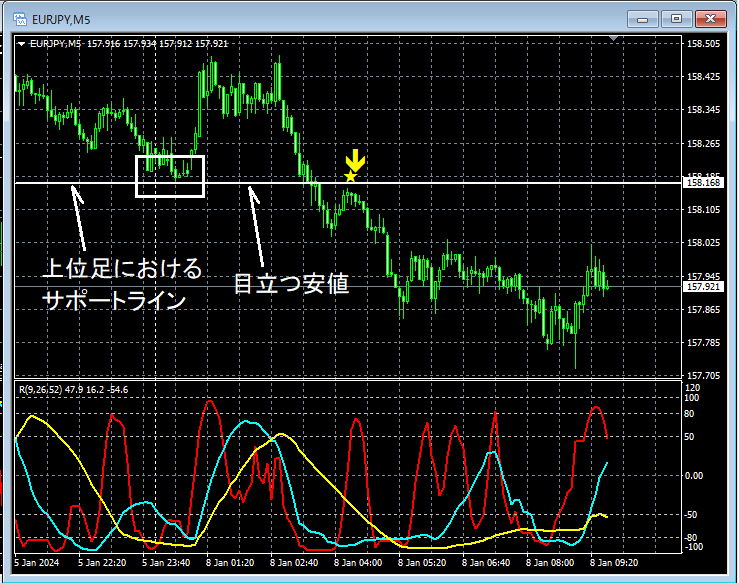
On the 5-minute chart above,the higher-timeframe support line anda notable lowmBDSR (Filter: RCI26 and RCI52) pullback/sell signal lights up, and price then drifts a bit lower.
From this example,a trading method that focuses on support lines and notable lows andthe signal of mBDSR show a strong compatibility.
Indicator that delivers power in combination with RCI【BODSOR・mBDSR】
Methods・Case Studies (PDF) ★GogoJungle AWARD 2020 Winner★
https://www.gogojungle.co.jp/tools/indicators/11836
The PDF file includes 283 items.
Many of them are examples that analyze multiple lower-timeframe conditions by logically linking higher and lower timeframes using three RCI lines, and ultimately waiting for the timing to buy on dips or sell on rallies on the lower timeframe (i.e., the mBDSR signal)..
Also,many emphasize catching points where multiple entry reasons coincide.
In the explanations,more than 1,000 chartsare used.

× ![]()


