

Roll Reversal, Double Bottom, Trend Reversal, and mBDSR (RCI 2-Filters) Signal
0
Indicator that shines in combination with RCI【BODSOR・mBDSR】
and methodology / case studies (PDF) ★GogoJungle AWARD 2020 Winner★
https://www.gogojungle.co.jp/tools/indicators/11836
283 PDF files are included.
Many of them are examples that have been organized to logically link higher and lower timeframes using 3 RCI lines, sequentially examining the conditions of multiple lower timeframes, and ultimately waiting for a pullback buying or pullback selling timing on the lower timeframe (i.e., the mBDSR signal)..
Also,many focus on catching points where multiple entry reasons overlap..
In the explanations,more than 1,000 chartsare used.

In recent Investor Navigator+ articles,we showcase examples that illustrate the high compatibility between various trading methods and the mBDSR signals.
USDCAD 15-minute chart
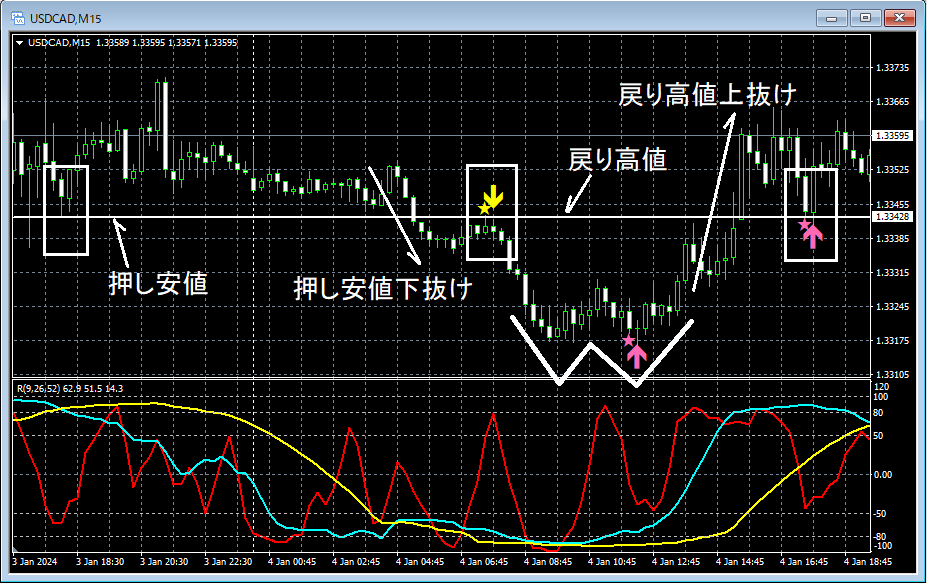
On the above 15-minute chart, first,the swing lowis broken below, andthe swing lowrises up to around that areaa roll reversalbegins to fall,the mBDSR (filters: RCI26 and RCI52) selling signallights up.
Additionally,from a double bottomto awhere the uptrend starts,the mBDSR (filters: RCI26 and RCI52) pullback buying signallights up.
Furthermore,the breakout of the swing highand then a pullback to around thatswing higharea,a roll reversalbegins to rise,the mBDSR (filters: RCI26 and RCI52) pullback buying signallights up.
From this example,a trade approach focused on roll reversals and double bottomsandmBDSR signalsshow strong compatibility.
Indicator that shines in combination with RCI【BODSOR・mBDSR】
and methodology / case studies (PDF) ★GogoJungle AWARD 2020 Winner★
https://www.gogojungle.co.jp/tools/indicators/11836
283 PDF files are included.
Many of them are examples that have been organized to logically link higher and lower timeframes using 3 RCI lines, sequentially examining the conditions of multiple lower timeframes, and ultimately waiting for a pullback buying or pullback selling timing on the lower timeframe (i.e., the mBDSR signal)..
Also,many focus on catching points where multiple entry reasons overlap..
In the explanations,more than 1,000 chartsare used.

× ![]()


