

Trends in Gold (XAUUSD) at the Start of the Year: Signals from Three RCI Lines, Double Top, and mBDSR (RCI Two-Line Filter)
0
Indicator that shines in combination with RCI: BODSOR・mBDSR
Methods and Case Studies (PDF) ★GogoJungle AWARD 2020 Winner★
https://www.gogojungle.co.jp/tools/indicators/11836
A PDF file with 283 items is included.
Many of them are examples that have been distilled into a form where multiple lower-timeframe conditions are logically linked with higher-timeframe conditions using three RCI lines, and finally waiting for the timing of a pullback buying or pullback selling on the lower timeframes (i.e., the mBDSR signal)..
Also,many focus on capturing points where multiple entry bases overlap..
In the explanations,more than 1,000 chartsare used.

In recent InvestingNavi+ articles,we present mainly examples that illustrate the high compatibility between various trading methods and the mBDSR signals.
Gold XAUUSD 4-hour chart
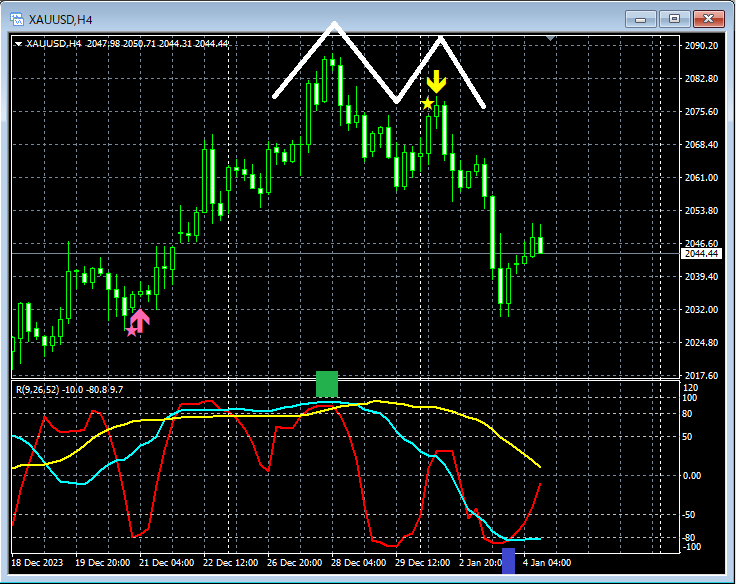
In the 4-hour chart above, first, at year-endmBDSR (Filter: RCI26 and RCI52) pullback buy signal lights up, rising to the so-calledRCI 3-peak top shape (green box) and then turning down. At the turn of the year,mBDSR (Filter: RCI26 and RCI52) pullback selling signal lights up, and thereafter, price progresses smoothly to the so-calledRCI double bottom shape (blue box) by continuing to fall.
Also, notably,a returning signal lights up on the right side of the double top; this is another point of interest.
From this example,the strong compatibility between a trading method focused on RCI three-line setups and double tops andthe mBDSR signal is evident.
Indicator that shines in combination with RCI: BODSOR・mBDSR
Methods and Case Studies (PDF) ★GogoJungle AWARD 2020 Winner★
https://www.gogojungle.co.jp/tools/indicators/11836
A PDF file with 283 items is included.
Many of them are examples that have been distilled into a form where multiple lower-timeframe conditions are logically linked with higher-timeframe conditions using three RCI lines, and finally waiting for the timing of a pullback buying or pullback selling on the lower timeframes (i.e., the mBDSR signal)..
Also,many focus on capturing points where multiple entry bases overlap..
In the explanations,more than 1,000 chartsare used.

× ![]()


