

5分足で出遅れたら15分足で。mBDSR(RCI2本フィルター)の戻り売りサイン。
Indicator that shines in combination with RCI【BODSOR・mBDSR】
and methods / case studies (PDF) ★GogoJungle AWARD2020 winner★
https://www.gogojungle.co.jp/tools/indicators/11836
283 PDF files are included.
Many of them are abouta set of examples that logically link higher and lower timeframes using three RCI lines, then gradually analyze the conditions of multiple lower timeframes, and finally wait for a timing to buy on dips or sell on rallies on the lower timeframe (i.e., the mBDSR signal).
Also,many emphasize capturing points where multiple entry reasons overlap.
In the explanations,more than 1,000 chartsare used.

In recent Investment Navigator+ articles,we focus on examples that illustrate the high compatibility between various trading methods and the mBDSR signal.
GBP/JPY 5-minute chart
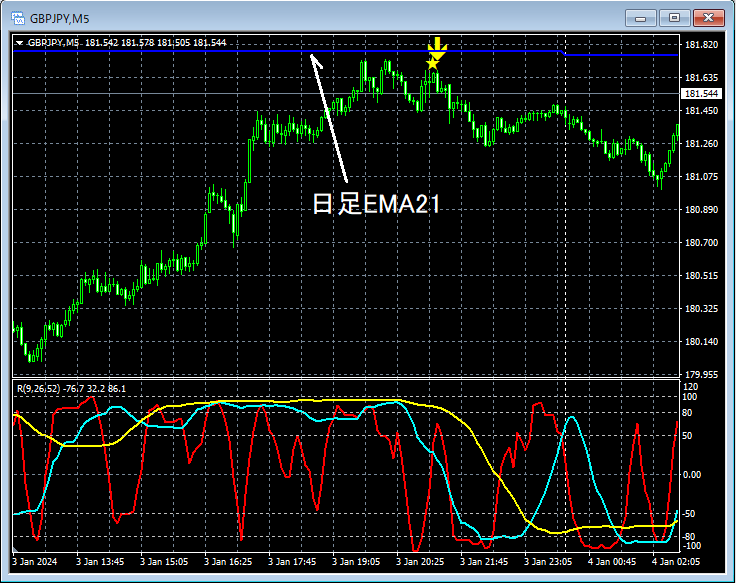
For the higher timeframe status, it is omitted. On the 5-minute chart, the notableDaily EMA21 rose to nearly this levelmBDSR (filters: RCI26 and RCI52) pullback sell signal lit up, and afterward, price declined steadily.
GBP/JPY 15-minute chart
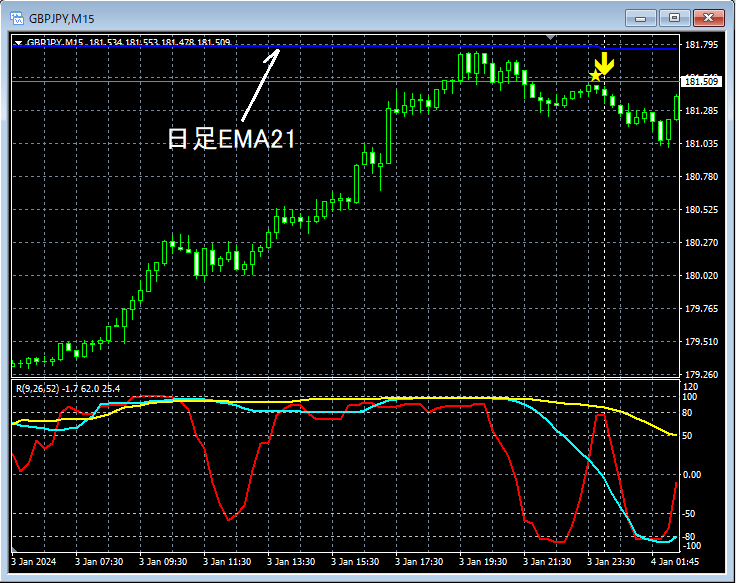
We will also look at the movement after the signal lit up on the aforementioned 5-minute chart. Looking at the 15-minute chart above, after the signal lit on the 5-minute chart and a brief decline, the risemBDSR (filters: RCI26 and RCI52) pullback sell signal lit up, and afterward, price declined steadily.
From this example,a trading method focused on the moving averages of the higher timeframeandthe compatibility with the mBDSR signalis evident.
Indicator that shines in combination with RCI【BODSOR・mBDSR】
and methods / case studies (PDF) ★GogoJungle AWARD2020 winner★
https://www.gogojungle.co.jp/tools/indicators/11836
283 PDF files are included.
Many of them are abouta set of examples that logically link higher and lower timeframes using three RCI lines, then gradually analyze the conditions of multiple lower timeframes, and finally wait for a timing to buy on dips or sell on rallies on the lower timeframe (i.e., the mBDSR signal).
Also,many emphasize capturing points where multiple entry reasons overlap.
In the explanations,more than 1,000 chartsare used.

× ![]()


