

Upward moving average, neck line, and mBDSR (RCI two-filter) reversal sell signal
Indicator that demonstrates power in combination with RCI【BODSOR・mBDSR】
and methods and case studies (PDF) ★GogoJungle AWARD2020 winner★
https://www.gogojungle.co.jp/tools/indicators/11836
The PDF files included total 283.
Most of them are examples that have been distilled to a form where, by using three RCI lines to logically link higher and lower timeframes, the situations of multiple lower timeframes are examined sequentially, and finally wait for a pullback buy or pullback sell timing on the lower timeframe (i.e., the mBDSR signal)..
Also,many focus on capturing points where multiple entry reasons coincide.There are many of those as well.
In the explanations,more than 1,000 chartsare used.

In recent investment navigate+ articles,examples that illustrate the high compatibility between various trading methods and the mBDSR signalare introduced focusing on those.
USD/JPY 15-minute chart
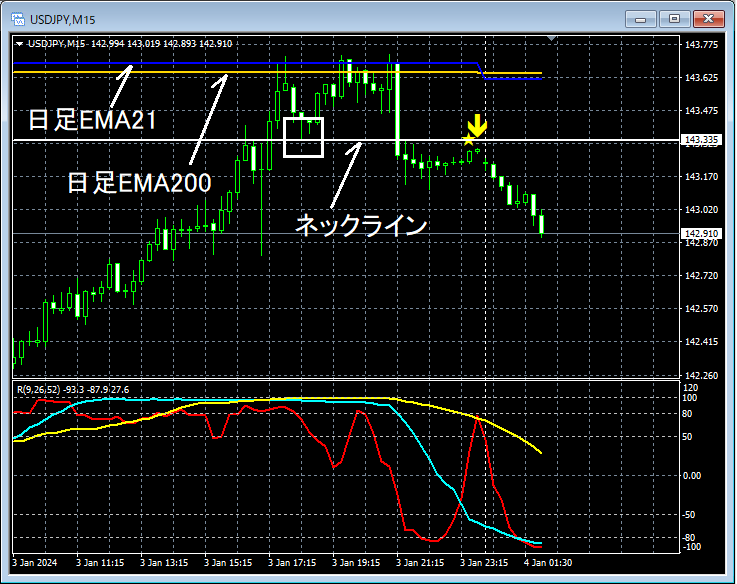
For the higher timeframe, omitted. On the 15-minute chart above, the key wasthe daily EMA21andthe daily EMA200overlapped area after rising, then retraced. Andneckline break. Around the point where it rose close to thenecklinethe mBDSR (filter: RCI26 and RCI52) sell signallights up, and price then steadily declines.
From this example,the harmony between trend-following methods focusing on moving averages and necklineandthe mBDSR signalis evident.
Indicator that demonstrates power in combination with RCI【BODSOR・mBDSR】
and methods and case studies (PDF) ★GogoJungle AWARD2020 winner★
https://www.gogojungle.co.jp/tools/indicators/11836
The PDF files included total 283.
Most of them are examples that have been distilled to a form where, by using three RCI lines to logically link higher and lower timeframes, the situations of multiple lower timeframes are examined sequentially, and finally wait for a pullback buy or pullback sell timing on the lower timeframe (i.e., the mBDSR signal)..
Also,many focus on capturing points where multiple entry reasons coincide.There are many of those as well.
In the explanations,more than 1,000 chartsare used.

× ![]()


