

GBP/JPY: RCI three-line signal, pin bar, and mBDSR (RCI two-line filter) retracement sell signal
0
Indicator that shows its power in combination with RCI【BODSOR・mBDSR】
Methods and Case Studies (PDF) ★GogoJungle AWARD2020 Winner★
https://www.gogojungle.co.jp/tools/indicators/11836
The PDF file includes 283 items.
Most of them are examples that have been laid out to logically link the higher and lower timeframes using three RCI lines, examine the conditions of multiple lower timeframes in sequence, and ultimately wait for the timing of pullbacks ortests to sell on retracements on the lower timeframes (i.e., the mBDSR signal)..
Also,many emphasize capturing points where multiple entry bases overlap..
In the explanations,more than 1,000 chartsare used.

In recent Invest Navigator+ articles,examples that show the high compatibility between various trading methods and the mBDSR signalsare highlighted.
GBP/JPY 4-hour chart
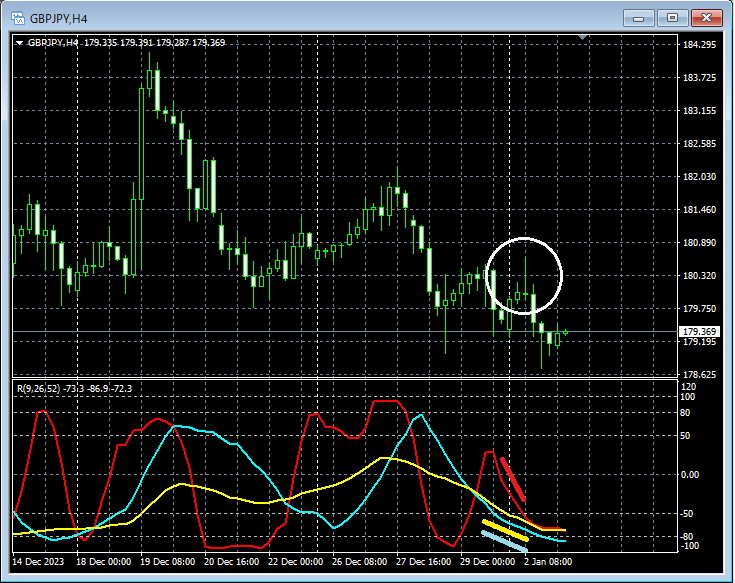
If you look at the area circled in white on the top 4-hour chart,the three RCI lines align and indicate a strong downward movewith a very weak form, suggesting further declinesa long upper shadow candle (pin bar)appears. It may not be strange to consider further downside.
GBP/JPY 5-minute chart
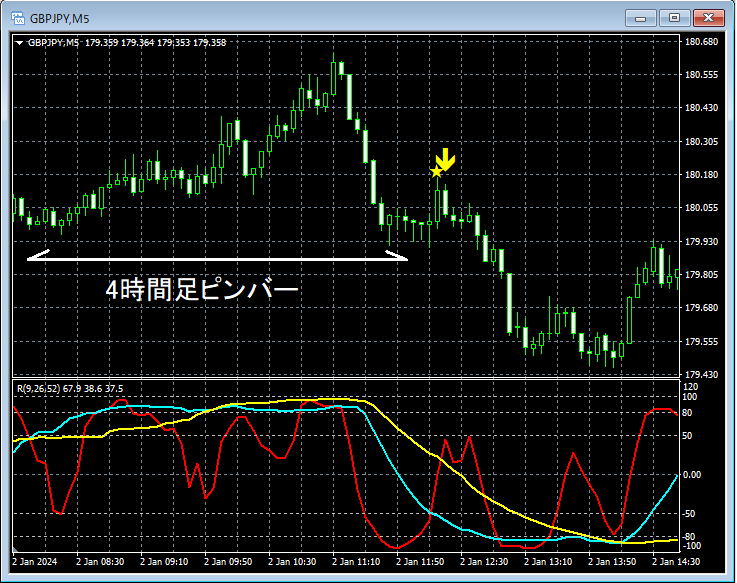
On the 5-minute chart above, after thepin barappears on the 4-hour chart,mBDSR (filter: RCI26 and RCI52)lights up, and afterward, price trends downward smoothly.
From this example,the high compatibility between RCI three-line signals and pin barsandmBDSR signalsbecomes evident.
Indicator that shines in combination with RCI【BODSOR・mBDSR】
Methods and Case Studies (PDF) ★GogoJungle AWARD2020 Winner★
https://www.gogojungle.co.jp/tools/indicators/11836
The PDF file includes 283 items.
Most of them are examples that have been laid out to logically link the higher and lower timeframes using three RCI lines, examine the conditions of multiple lower timeframes in sequence, and ultimately wait for the timing of pullbacks or tests on the lower timeframes (i.e., the mBDSR signal).
Also,many emphasize capturing points where multiple entry bases overlap..
In the explanations,more than 1,000 chartsare used.

× ![]()


