

Moving Average Line, Double Top, and mBDSR (RCI two-filter) Overbought Signal
0
Indicator that delivers power in combination with RCI【BODSOR・mBDSR】
Methods and Case Studies (PDF) ★GogoJungle AWARD 2020 Winner★
https://www.gogojungle.co.jp/tools/indicators/11836
The PDF file contains 283 items.
Most of them are examples that have been distilled into a form where, by logically linking the higher and lower timeframes using three RCI lines, the situation of multiple lower timeframes is examined sequentially, and finally you wait for a timing to buy on dips or sell on rallies in the lower timeframe (i.e., the mBDSR signal)..
Also,there are many that focus on capturing points where multiple entry confirmations overlap..
In the explanations,more than 1,000 chartsare used.

In recent investor navigation+ articles,examples that show the high compatibility between various trading methods and the mBDSR signalare introduced as the main focus.
USD/JPY 5-minute chart
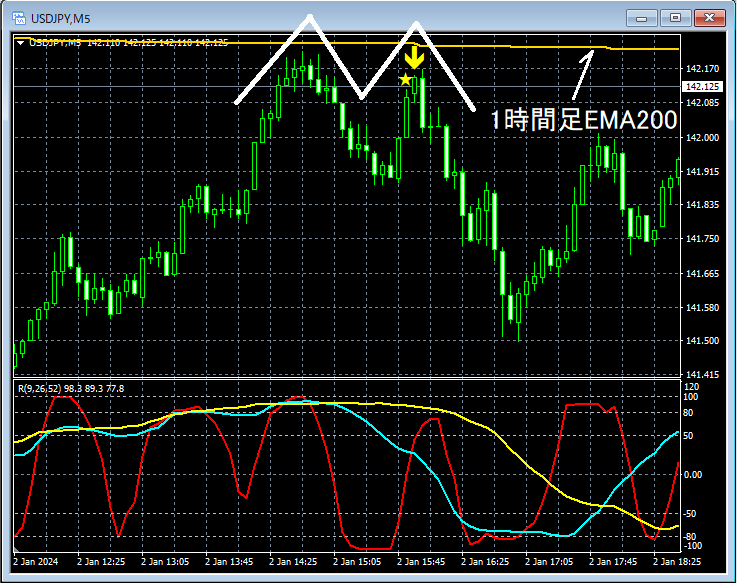
On the upper 5-minute chart,near the 1-hour EMA 200rises to near that levelmBDSR (filters: RCI26 and RCI52) sell signallights up, and then price proceeds to slide smoothly.
Also, as a result,the right side of a double topshows a sell signal on the pullback, which is noteworthy.
From this example,the high compatibility between a trading method that focuses on higher-timeframe moving averages and double topsandthe mBDSR signalis evident.
Additionally, in this example,placing a stop-loss slightly above the recent highis used,enabling high risk-reward trades.
Indicator that delivers power in combination with RCI【BODSOR・mBDSR】
Methods and Case Studies (PDF) ★GogoJungle AWARD 2020 Winner★
https://www.gogojungle.co.jp/tools/indicators/11836
The PDF file contains 283 items.
Most of them are examples that have been distilled into a form where, by logically linking the higher and lower timeframes using three RCI lines, the situation of multiple lower timeframes is examined sequentially, and finally you wait for a timing to buy on dips or sell on rallies in the lower timeframe (i.e., the mBDSR signal).
Also,there are many that focus on capturing points where multiple entry confirmations overlap..
In the explanations,more than 1,000 chartsare used.

× ![]()


