

Past support line and mBDSR (RCI2-band filter) return sell signals
Indicator that shines in combination with RCI: 【BODSOR・mBDSR】
Methods and Case Studies (PDF) ★GogoJungle AWARD2020 Winner★
https://www.gogojungle.co.jp/tools/indicators/11836
The PDF file includes 283 items.
Many of them are examples that lay out a form where, by using three RCI lines to logically link higher and lower timeframes, the状況 of multiple lower-timeframe charts are examined in sequence, and finally waiting for pullbacks to buy on the lower timeframe or to sell on retracements (i.e., mbDSR signals)..
Also,many focus on capturing points where multiple entry justifications align..
In the explanations,more than 1,000 chartsare used.

In recent Investor Navi+ articles,examples that show the high compatibility between various trading methods and the mBDSR signalsare highlighted.
EUR/USD 15-minute chart
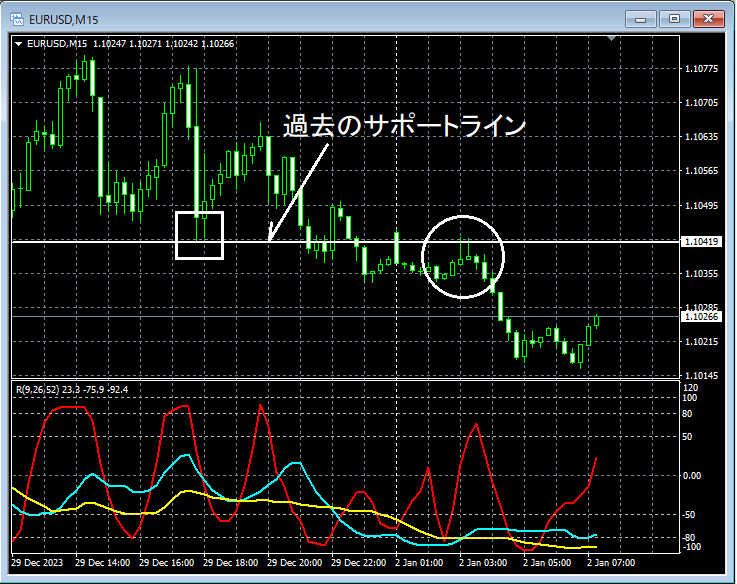
Looking at around the white circled area on the 15-minute chart above, it often acts as resistancepast support linesthat have risen to near that level. It may not be unusual to consider selling on retracements on lower timeframes.
EUR/USD 1-minute chart
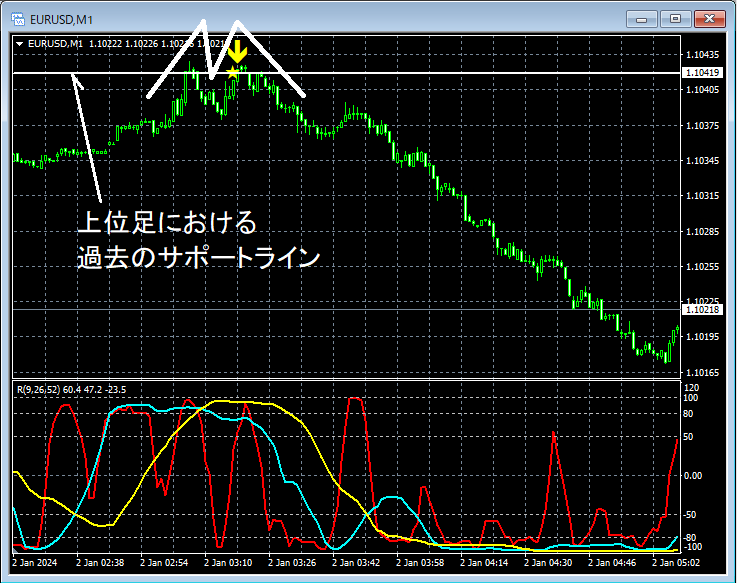
Looking at the 1-minute chart abovepast support lines on the higher timeframerising to near a previous support line on the higher timeframe,mBDSR (filters: RCI26 and RCI52) pullback sell signallights up, and price declines steadily.
As a result, on the right peak of a double top,mBDSR (filters: RCI26 and RCI52) pullback sell signallights up and price continues to move down.
From this example,the high compatibility between a trade method focused on past support lines and double topsandmBDSR signalsis evident.
Additionally, in this example,placing a stop loss slightly above the recent highhelps achievea high risk-reward trade.
Indicator that shines in combination with RCI: 【BODSOR・mBDSR】
Methods and Case Studies (PDF) ★GogoJungle AWARD2020 Winner★
https://www.gogojungle.co.jp/tools/indicators/11836
The PDF file includes 283 items.
Many of them are examples that lay out a form where, by using three RCI lines to logically link higher and lower timeframes, the状況 of multiple lower-timeframe charts are examined in sequence, and finally waiting for pullbacks to buy on the lower timeframe or to sell on retracements (i.e., mbDSR signals)..
Also,many focus on capturing points where multiple entry justifications align..
In the explanations,more than 1,000 chartsare used.

× ![]()


