

Resistance line and mBDSR (RCI2 two-filter) short signal
Indicator that shines when combined with RCI: BODSOR・mBDSR
Methods and Case Studies (PDF) ★GogoJungle AWARD 2020 winner★
https://www.gogojungle.co.jp/tools/indicators/11836
The PDF file includes 283 items.
Many of them are examples that have been distilled into a form where, by linking higher and lower timeframes logically using three RCI lines, the situations of multiple lower timeframes are examined sequentially, and finally a timing for buying on dips or selling on retracements on the lower timeframe (the mBDSR signal) is waited for..
Also,many focus on capturing points where multiple entry reasons overlap.
In the explanations,more than 1,000 charts are used.

In recent InvestorNavi+ articles,we highlight examples that show the high compatibility between various trading methods and the mBDSR signals.
NZDJPY 4-hour chart
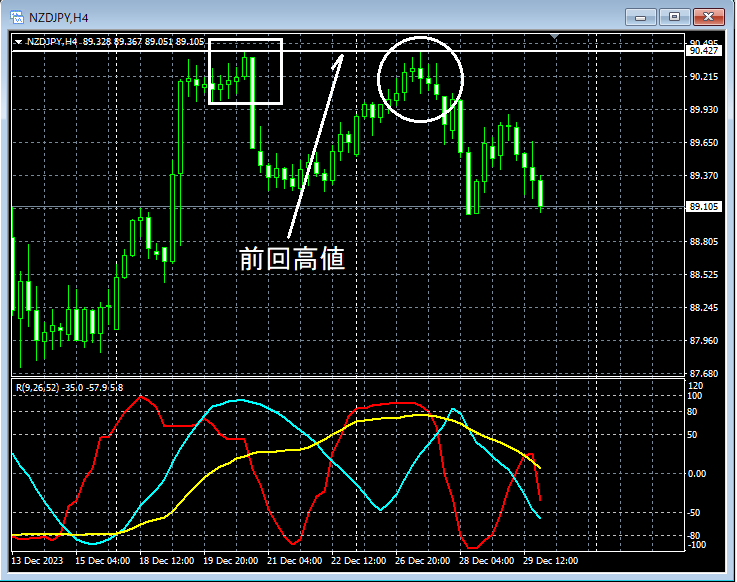
In the upper 4-hour chart, around the area circled in white,the previous highhas risen nearby, and it wouldn’t be surprising if it drops a little for a while.
NZDJPY 30-minute chart
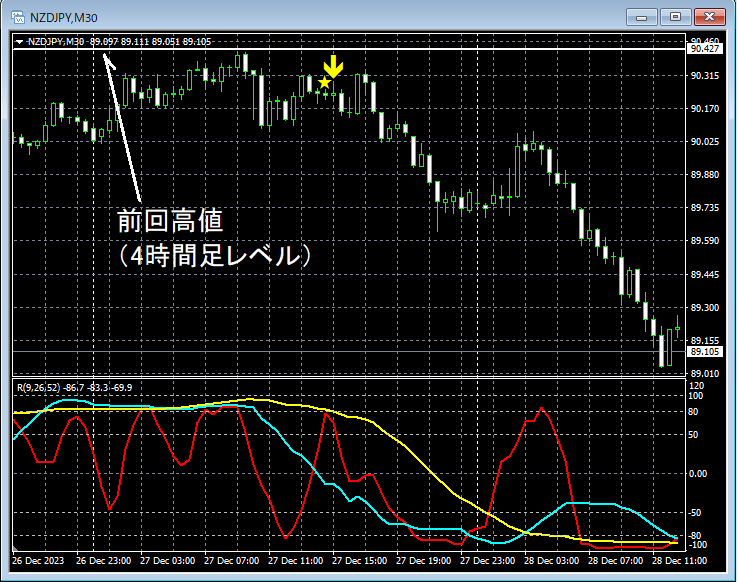
Looking at the upper 30-minute chart,the line indicating the previous high on the higher timeframehas risen to near that level,mBDSR (two RCI lines filtered) sell signal on retracelights up. After that, the price drops sharply.
From this example,a trade method focused on the previous highandthe mBDSR signalshow a high degree of compatibility.
Indicator that shines when combined with RCI: BODSOR・mBDSR
Methods and Case Studies (PDF) ★GogoJungle AWARD 2020 winner★
https://www.gogojungle.co.jp/tools/indicators/11836
The PDF file includes 283 items.
Many of them are examples that have been distilled into a form where, by linking higher and lower timeframes logically using three RCI lines, the situations of multiple lower timeframes are examined sequentially, and finally a timing for buying on dips or selling on retracements on the lower timeframe (the mBDSR signal) is waited for.
Also,many focus on capturing points where multiple entry reasons overlap.
In the explanations,more than 1,000 charts are used.
× ![]()


