

A method focusing on the resistance-support transition line and the bullish signal of mBDSR (RCI with 2 filters)
0
Indicator that shines when combined with RCI【BODSOR・mBDSR】
Methods, Case Studies (PDF) ★GogoJungle AWARD2020 Winner★
https://www.gogojungle.co.jp/tools/indicators/11836
The PDF files included amount to 283.
Many of them are examples that have been distilled into a form where, by using three RCI lines to logically link higher and lower timeframes, the状況 of multiple lower timeframes are sequentially considered, and ultimately wait for the timing to buy on dips or sell at retracements on the lower timeframe (i.e., the mBDSR signal)..
Also,many focus on identifying points where multiple entry reasons overlap..
The description usesmore than 1,000 charts..

In recent Investment Navigator+ articles,you can see high compatibility between various trading methods and the mBDSR signalsthrough examples.
AUDNZD 4-hour chart
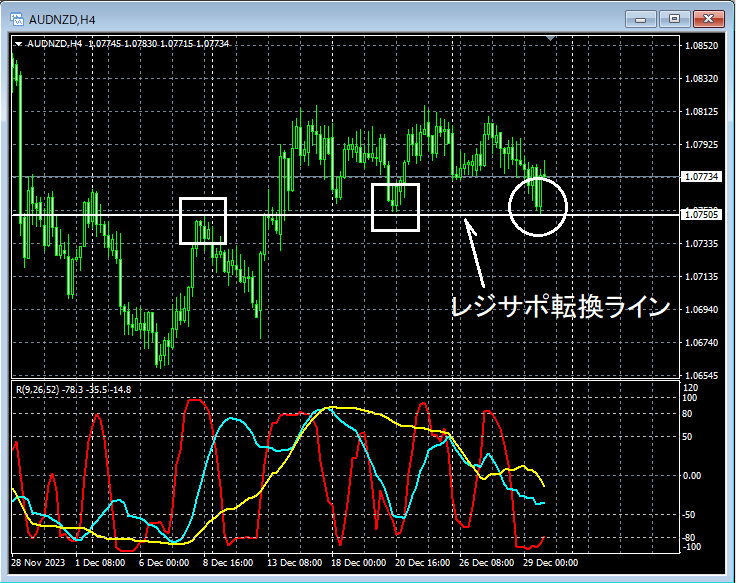
Looking at around the area circled in white on the 4-hour chart above, it often functions as supportSupport/Resistance reversal linehas been pulled down close to it, making dip-buying a plausible consideration in this scene.
AUDNZD 5-minute chart
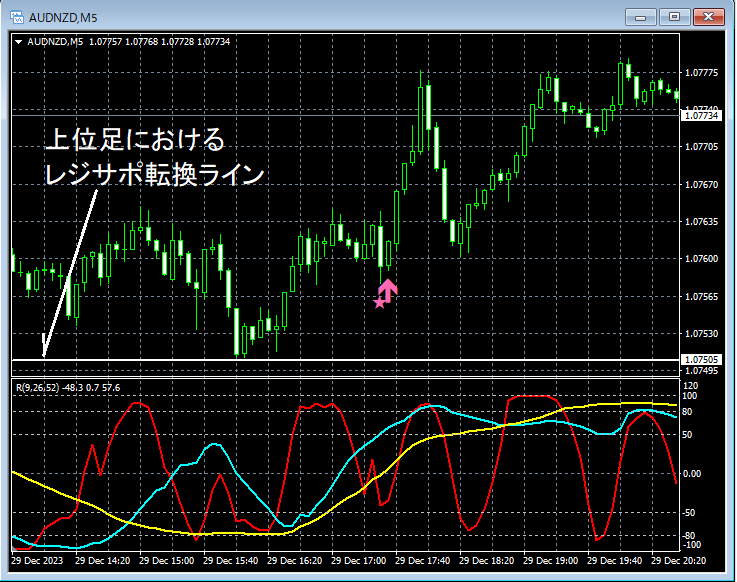
On the 5-minute chart above,the higher-timeframe support/resistance reversal linereverses near this area. And then,mBDSR (filter: RCI26 and RCI52) dip-buy signallights up, and price subsequently rises smoothly.
From this example,the high compatibility between a trade method focused on the support/resistance reversal lineandthe mBDSR signalsis evident.
Indicator that shines when combined with RCI【BODSOR・mBDSR】
Methods, Case Studies (PDF) ★GogoJungle AWARD2020 Winner★
https://www.gogojungle.co.jp/tools/indicators/11836
The PDF files included amount to 283.
Many of them are examples that have been distilled into a form where, by using three RCI lines to logically link higher and lower timeframes, the状況 of multiple lower timeframes are sequentially considered, and ultimately wait for the timing to buy on dips or sell at retracements on the lower timeframe (i.e., the mBDSR signal)..
Also,many focus on identifying points where multiple entry reasons overlap..
The description usesmore than 1,000 charts..

× ![]()


