

Resistance line, pullback lows, and the mBDSR (RCI two-filter) inverse/short signal
0
An indicator that shines in combination with RCI: BODSOR・mBDSR
Methods and Case Studies (PDF) ★GogoJungle AWARD 2020 Recipient★
https://www.gogojungle.co.jp/tools/indicators/11836
The PDF file is included with 283 items.
Most of them are examples that have been consolidated into a form that logically links higher time frames and lower time frames using three RCI lines, so as to sequentially examine the situations of multiple lower time frames and ultimately wait for a pullback buy or a pullback sell timing on the lower time frame (the mBDSR signal)..
Also,many focus on capturing points where multiple entry reasons coincideas well.
In the explanations,more than 1,000 chartsare used.

In recent Investor Navi+ articles,we highlight the high compatibility between various trading methods and the mBDSR signalsby focusing on examples that illustrate this.
NZD/CAD 4-hour chart
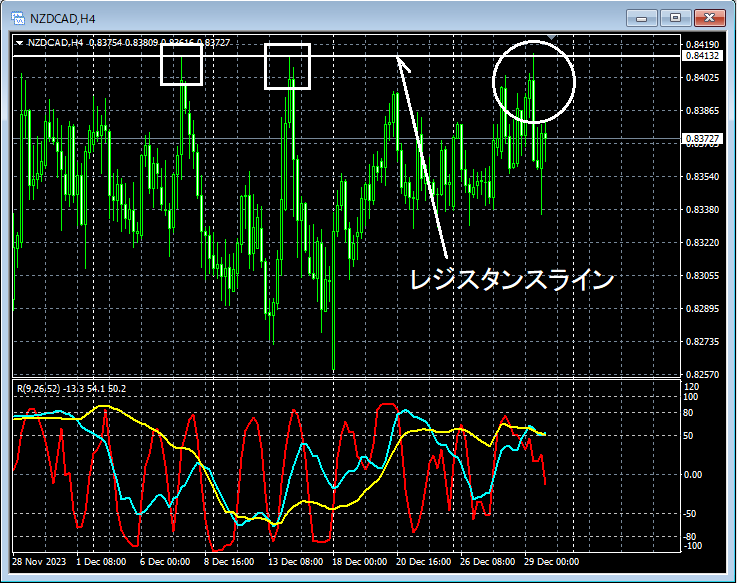
In the upper 4-hour chart, around the area circled with a white circle, the price has risen to near a level where it could not break through theresistance linebefore, suggesting it may drop slightly for now.
NZD/CAD 5-minute chart
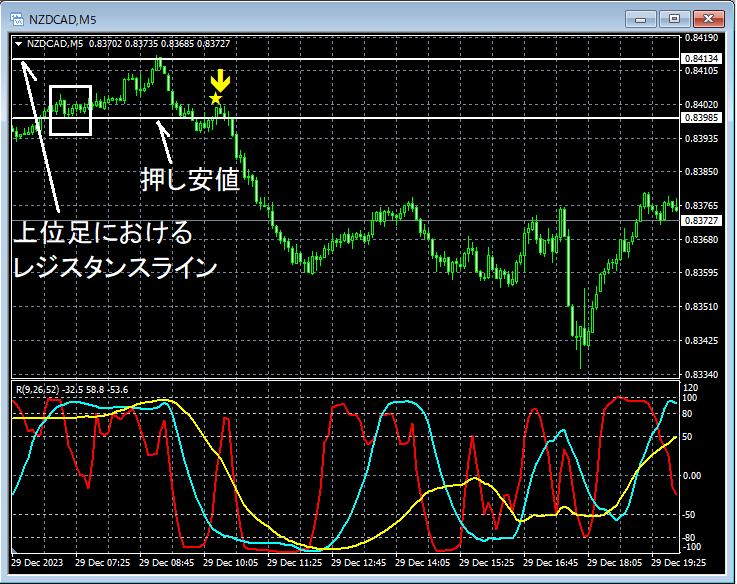
Looking at the 5-minute chart above,the resistance linerises to near the level, then turns down. After brieflybreaking the swing lowand then retracing,the mBDSR (two RCI filters) pullback sell signallights up, and price subsequently trends down smoothly.
From this example,there is a strong synergy between trading methods that focus on resistance lines and swing lowsandmBDSR signals.
An indicator that shines in combination with RCI【BODSOR・mBDSR】
Methods and Case Studies (PDF) ★GogoJungle AWARD 2020 Recipient★
https://www.gogojungle.co.jp/tools/indicators/11836
The PDF file is included with 283 items.
Most of them are examples that have been consolidated into a form that logically links higher time frames and lower time frames using three RCI lines, so as to sequentially examine the situations of multiple lower time frames and ultimately wait for a pullback buy or a pullback sell timing on the lower time frame (the mBDSR signal).Also,
many focus on capturing points where multiple entry reasons coincideas well.
In the explanations,more than 1,000 chartsare used.
× ![]()


