

December 29 Pound/Yen 1-minute chart mBDSR (RCI with 2 lines filter) Sign example – Trend reversal –
0
An indicator that shows power in combination with RCI: BODSOR and mBDSR
Methodologies and Case Studies (PDF) ★GogoJungle AWARD2020 winner★
https://www.gogojungle.co.jp/tools/indicators/11836
The PDF file includes 283 items.
Many of them are examples that break down how to logically link higher and lower timeframes using three RCI lines (RCI3 lines), and ultimately wait for lower-timeframe pullbacks or pullbacks to enter (the mBDSR signal).They are.
Also,many focus on capturing points where multiple entry reasons overlap.
The explanations usemore than 1,000 charts.

In this article, from the most recent charts,the timing of buying or selling at trend reversalsis effectively captured bythe mBDSR signal (RCI two-filter).
GBP/JPY 1-minute chart
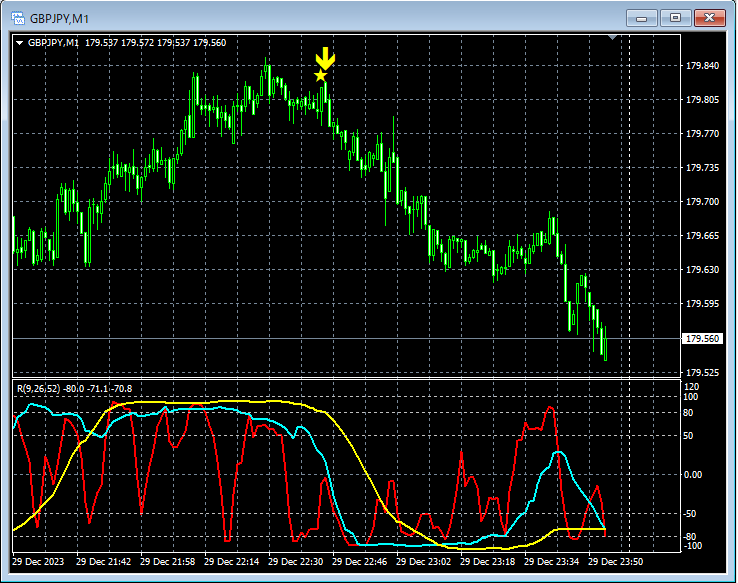
Main window:mBDSR (filter: RCI26 and RCI52)
Sub window:RCI three lines (RCI9, RCI26, RCI52)
As in this example, especially when aiming fortrend reversals, placing a stop loss slightly above the recent highcan lead tohigh risk-reward trades, which isa major characteristic of“RCImBDSR Market Reversal Theory”.
An indicator that shows power in combination with RCI: BODSOR and mBDSR
Methodologies and Case Studies (PDF) ★GogoJungle AWARD2020 winner★
https://www.gogojungle.co.jp/tools/indicators/11836
The PDF file includes 283 items.
The majority of them are examples that break down how to logically link higher and lower timeframes using three RCI lines and, ultimately, wait for lower-timeframe pullbacks or pullbacks to enter (the mBDSR signal)..
Also,many focus on capturing points where multiple entry reasons overlap..
The explanations usemore than 1,000 charts.

× ![]()


