

RCI3 main line and moving average line and mBDSR (RCI2 filter) signal
Indicator that shines in combination with RCI【BODSOR・mBDSR】
Method and Case Studies (PDF) ★GogoJungle AWARD 2020 Recipient★
https://www.gogojungle.co.jp/tools/indicators/11836
A PDF file with 283 items is attached.
Most of them are summarized as examples that logically link the higher and lower timeframes using three RCI lines, examining the conditions of multiple lower timeframes sequentially, and finally waiting for the timing to buy on dips or sell on rallies in the lower timeframe (=mBDSR signal)..
Also,many emphasize capturing points where multiple entry reasons overlap.
In the explanations,more than 1,000 chartsare used.

In recent Investing Navigator+ articles,the high compatibility between various trading methods and mBDSR signals is shownthrough examples.
CADJPY Weekly
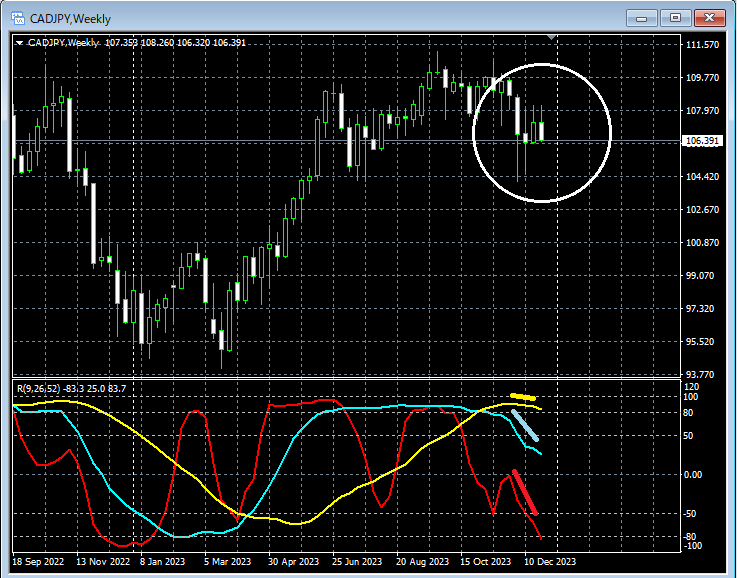
Looking at the area circled in white on the weekly chart above,the three RCI lines line up to point downwardsindicating a very weak shape. Also, although the chart is omitted, on the daily timeframe as wellthe three RCI lines line up to point downwardsindicating a very weak shape. It might not be strange to consider selling on rallies on the lower timeframe.
CADJPY 4-hour
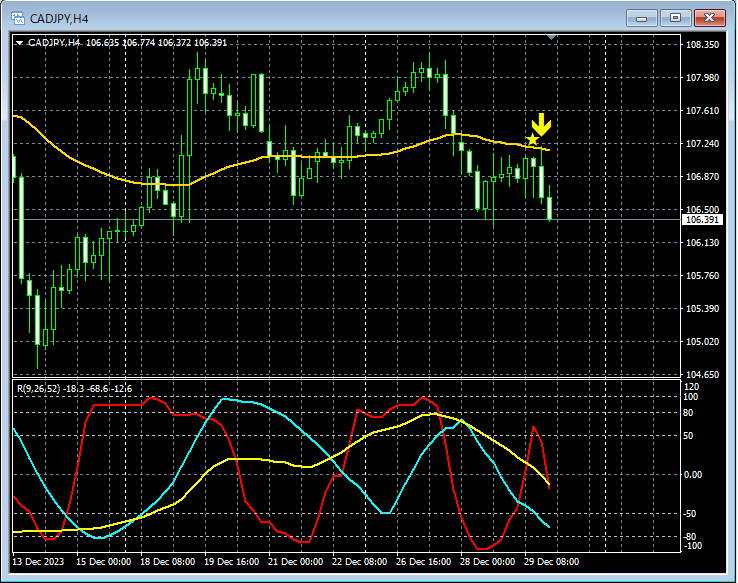
On the 4-hour chart above,near the EMA200 on the 1-hour chartrises up to aroundmBDSR (Filter: RCI26 and RCI52) sell signallights up, and subsequently the price declines steadily.
From this example,there is a strong compatibility between trading methods that focus on RCI three-line method and moving averagesandmBDSR signals.
Indicator that shines in combination with RCI【BODSOR・mBDSR】
Method and Case Studies (PDF) ★GogoJungle AWARD 2020 Recipient★
https://www.gogojungle.co.jp/tools/indicators/11836
A PDF file with 283 items is attached.
Most of them are summarized as examples that logically link the higher and lower timeframes using three RCI lines, examining the conditions of multiple lower timeframes sequentially, and finally waiting for the timing to buy on dips or sell on rallies in the lower timeframe (=mBDSR signal)..
Also,many emphasize capturing points where multiple entry reasons overlap.
In the explanations,more than 1,000 chartsare used.

× ![]()


