

RCI3 single line and sag support conversion and mBDSR (RCI2 single filter) sign
Indicator that shines in combination with RCI: 【BODSOR・mBDSR】
Method and Case Study (PDF) ★GogoJungle AWARD 2020 Winner★
https://www.gogojungle.co.jp/tools/indicators/11836
The PDF file comes with 283 items.
Many of them are arranged in a form that logically links higher time frames and lower time frames using RCI three-line, sequentially considering the conditions of multiple lower time frames, and ultimately waiting for a timing to buy on dips or sell on rallies in the lower time frame (the mBDSR signal)..
Also,many focus on capturing points where multiple entry reasons overlap..
In the explanations,more than 1,000 chartsare used.

In recent Investment Navigator+ articles,examples showing the high compatibility between various trading methods and the mBDSR signalsare introduced focusing on those.
NZDJPY 1-Hour Chart
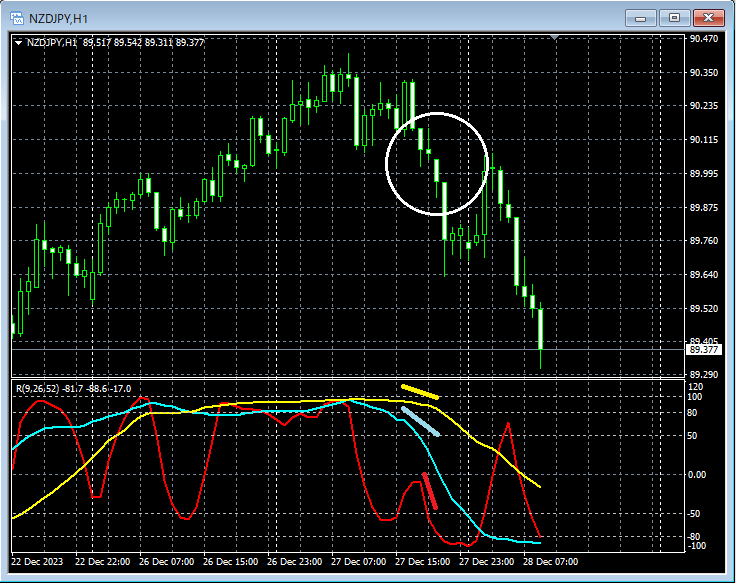
Looking at the area circled by white on the 1-hour chart above,the three RCI lines line up and declineindicating a very weak setup. It may also be reasonable to consider selling rallies on the lower time frame.
NZDJPY 5-Minute Chart
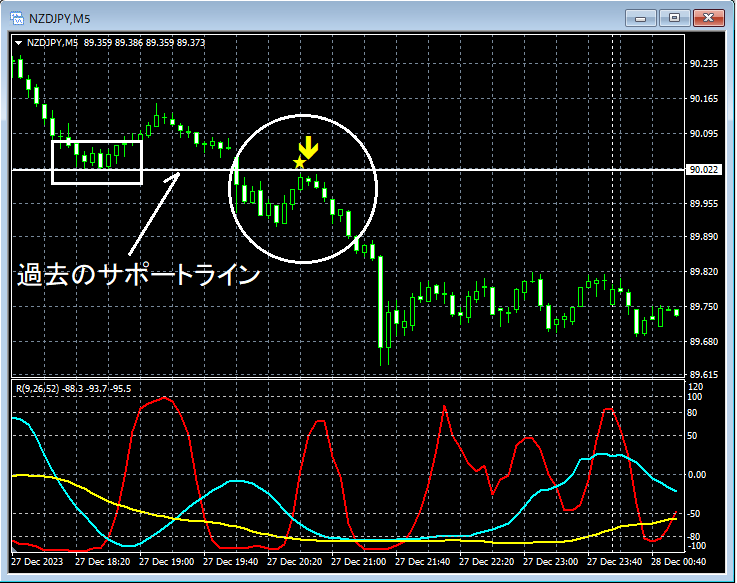
On the 5-minute chart above,the past support lineis broken and then rises again toward that vicinitythe mBDSR (Filter: RCI26 and RCI52) pullback sell signallights up, and subsequently the price declines smoothly.
From this example,the high compatibility between a trading method that focuses on lines that previously acted as support or support-turned resistanceandthe mBDSR signalis evident.
Indicator that shines in combination with RCI: 【BODSOR・mBDSR】
Method and Case Study (PDF) ★GogoJungle AWARD2020 Winner★
https://www.gogojungle.co.jp/tools/indicators/11836
The PDF file comes with 283 items.
Many of them are arranged in a form that logically links higher time frames and lower time frames using RCI three-line, sequentially considering the conditions of multiple lower time frames, and ultimately waiting for a timing to buy on dips or sell on rallies in the lower time frame (the mBDSR signal).
Also,many focus on capturing points where multiple entry reasons overlap..
In the explanations,more than 1,000 chartsare used.

× ![]()


