

Dollar/Yen: Double top, RCI three-line, and mBDSR (RCI two-line filter) short-sell signal
Indicator that shines when combined with RCI: BODSOR and mBDSR
Methodology and Case Studies (PDF) ★GogoJungle AWARD2020 Winner★
https://www.gogojungle.co.jp/tools/indicators/11836
The PDF file includes 283 items.
Many of them are summarized as examples where, by using three RCI lines to logically link higher and lower timeframes, the situations of multiple lower timeframes are examined sequentially, and finally wait for a pullback buying or retracement selling timing (i.e., the mBDSR signal) on the lower timeframe..
Also,many emphasize identifying points where multiple entry reasons overlap..
In the explanations,more than 1,000 chartsare used.

In a recent Investor Navigator+ article,examples focusing on the high compatibility between various trading methods and the mBDSR signalare introduced.
USD/JPY Hourly
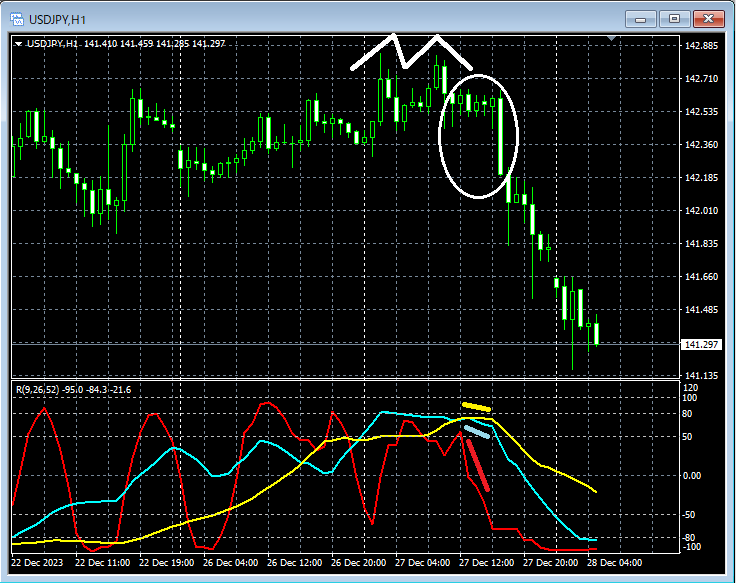
Looking at the hourly chart above,a potential double toppattern,the RCI three-line set indicates a declinein a very weak setup. It wouldn't be strange to consider a retracement sell on the lower timeframe. We will examine around the area encircled by the white ellipse on the 5-minute chart.
USD/JPY 5-minute
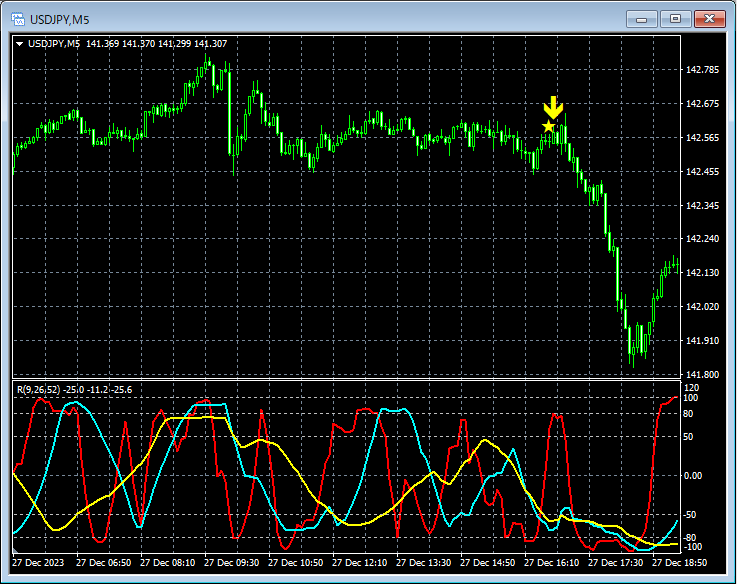
When watching the 5-minute chart above,the mBDSR (two RCI lines filter) retracement sell signallights up, and the price drops sharply.
From this example,a trading method focusing on the double topanda method focusing on the three RCI linesandthe mBDSR signalshow high compatibility.
Indicator that shines when combined with RCI: BODSOR and mBDSR
Methodology and Case Studies (PDF) ★GogoJungle AWARD2020 Winner★
https://www.gogojungle.co.jp/tools/indicators/11836
The PDF file includes 283 items.
Many of them are summarized as examples where, by using three RCI lines to logically link higher and lower timeframes, the situations of multiple lower timeframes are examined sequentially, and finally wait for a pullback buying or retracement selling timing (i.e., the mBDSR signal) on the lower timeframe..
Also,many emphasize identifying points where multiple entry reasons overlap..
In the explanations,more than 1,000 chartsare used.

× ![]()


