

A method focusing on past notable highs and a pullback buy signal with mBDSR (RCI two-band filter)
0
Indicator that shines in combination with RCI: BODSOR・mBDSR
Methods and Case Studies (PDF) ★GogoJungle AWARD 2020 Winner★
https://www.gogojungle.co.jp/tools/indicators/11836
The PDF file comes with 283 attachments.
Most of them are examples that break down the process of logically linking higher and lower time frames using three RCI lines, sequentially considering the conditions of multiple lower time frames, and finally waiting for a pullback buying or pullback selling timing on the lower time frame (i.e., the mBDSR signal)..
Also,many focus on identifying points where multiple entry reasons overlap..
In the explanations,more than 1,000 chartsare used.

In a recent Invest Navigator+ article,the high compatibility between various trading methods and mBDSR signals is highlighted with examples.We present mainly examples that demonstrate this.
EURUSD 1-hour chart
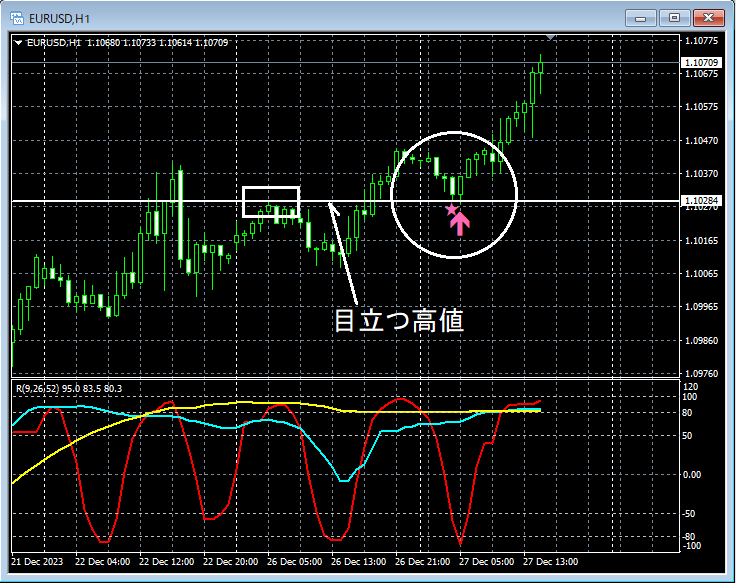
The higher timeframe conditions are omitted.
Near notable past highsthe price has fallen to a level wherethe mBDSR (two RCI filters) pullback-buy signallights up, and the price then rises steadily from there.
From this example,the high compatibility between a trade method that focuses on notable past highsandthe mBDSR signalis evident.
Indicator that shines in combination with RCI: BODSOR・mBDSR
Methods and Case Studies (PDF) ★GogoJungle AWARD 2020 Winner★
https://www.gogojungle.co.jp/tools/indicators/11836
The PDF file comes with 283 attachments.
Most of them are examples that break down the process of logically linking higher and lower time frames using three RCI lines, sequentially considering the conditions of multiple lower time frames, and finally waiting for a pullback buying or pullback selling timing on the lower time frame (i.e., the mBDSR signal)..
Also,many focus on identifying points where multiple entry reasons overlap..
In the explanations,more than 1,000 chartsare used.

× ![]()


