

Previously high price, head-and-shoulders, and mBDSR (RCI 2-line filter) short signal
0
An indicator that demonstrates power when used in combination with RCI【BODSOR・mBDSR】
and methods / case studies (PDF) ★GogoJungle AWARD2020 winner★
https://www.gogojungle.co.jp/tools/indicators/11836
The PDF file includes 283 items.
Many of them are examples that break down the process of logically linking higher and lower timeframes using three RCI lines, sequentially examining the conditions of multiple lower timeframes, and ultimately waiting for the timing to buy on pullbacks or sell on retracements on the lower timeframe (i.e., mbDSR signal)..
In addition,there are many that emphasize capturing points where multiple entry reasons overlap..
In the explanations,more than 1,000 chartsare used.

In recent Investor Navi+ articles,we focus on examples that show how compatible various trading methods are with mbDSR signals.
AUD/JPY 4-hour
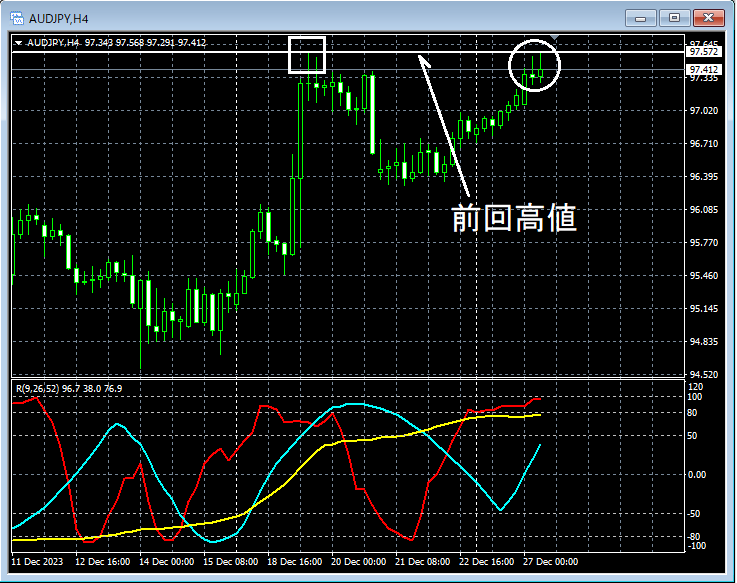
In the area circled with a white circle on the 4-hour chart above,prices have risen toward last high, and it wouldn’t be surprising if they pull back a little here.
AUD/JPY 1-minute
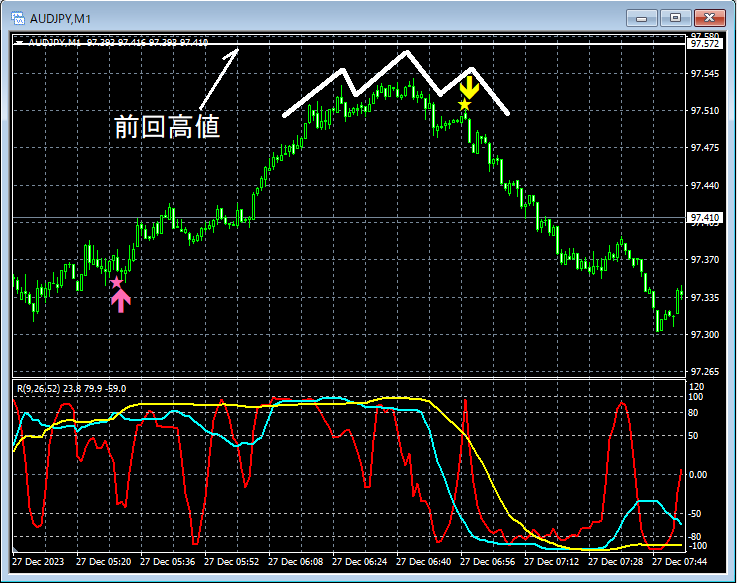
Looking at the 1-minute chart above,up to a few pips from the last high,mbDSR (RCI 2-line filter) pullback sell signal lights up, and price moves down.
As a result,the right shoulder of the head-and-shoulders pattern showsmbDSR (RCI 2-line filter) pullback sell signal turning on.
From this example,the high compatibility between trade methods that focus on the last high and head-and-shoulders andmbDSR signals is evident.
An indicator that shows power when used in combination with RCI【BODSOR・mBDSR】
and methods / case studies (PDF) ★GogoJungle AWARD2020 winner★
https://www.gogojungle.co.jp/tools/indicators/11836
The PDF file includes 283 items.
Many of them are examples that break down the process of logically linking higher and lower timeframes using three RCI lines, sequentially examining the conditions of multiple lower timeframes, and ultimately waiting for the timing to buy on pullbacks or sell on retracements on the lower timeframe (i.e., mbDSR signal)..
In addition,there are many that emphasize capturing points where multiple entry reasons overlap..
In the explanations,more than 1,000 chartsare used.

× ![]()


