

The harmony between RCI3 single-line and mBDSR signs and Elliott Wave patterns and various trading methods is high
Indicator that delivers power when combined with RCI【BODSOR・mBDSR】
Methods, case studies (PDF) ★GogoJungle AWARD 2020 winner★
https://www.gogojungle.co.jp/tools/indicators/11836
The PDF file includes 283 items.
Many of them are examples that break down how to logically link higher and lower timeframes using the 3-RCI lines, sequentially considering the conditions of multiple lower timeframes, and ultimately waiting for the timing to buy on dips or sell on rallies on the lower timeframe (i.e., mBDSR signals)..
Also,many focus on capturing points where multiple entry reasons overlap.
In the explanations,more than 1,000 chartsare used.

In recent Investors Navi+ articles,we present examples that highlight the high compatibility between various trading methods and mBDSR signals.
GBP/JPY Daily
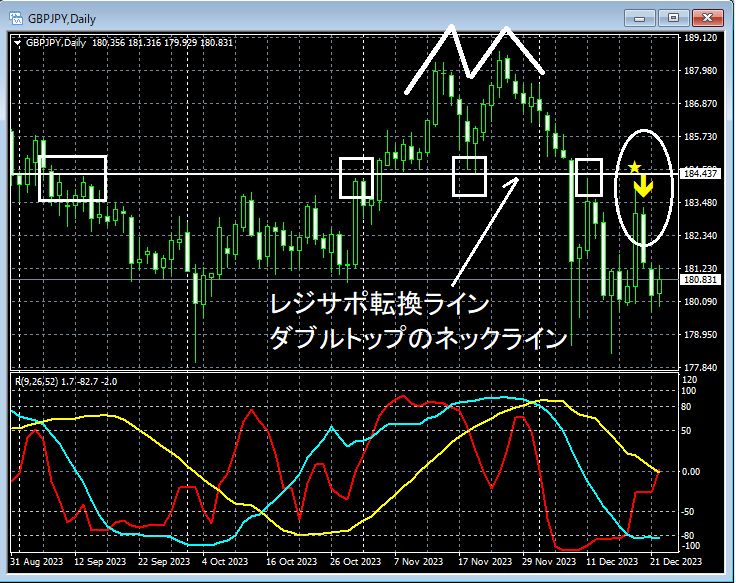
In the area circled in white on the upper daily chart,the resistance/support reversal line・neckline of a double topis reached,mBDSR (RCI two-filter) buyback signallights up and price declines. As shown on the 4-hour chart discussed later, this decline is in theElliott Waveof theDecline 5th wavephase.
GBP/JPY 4-hour
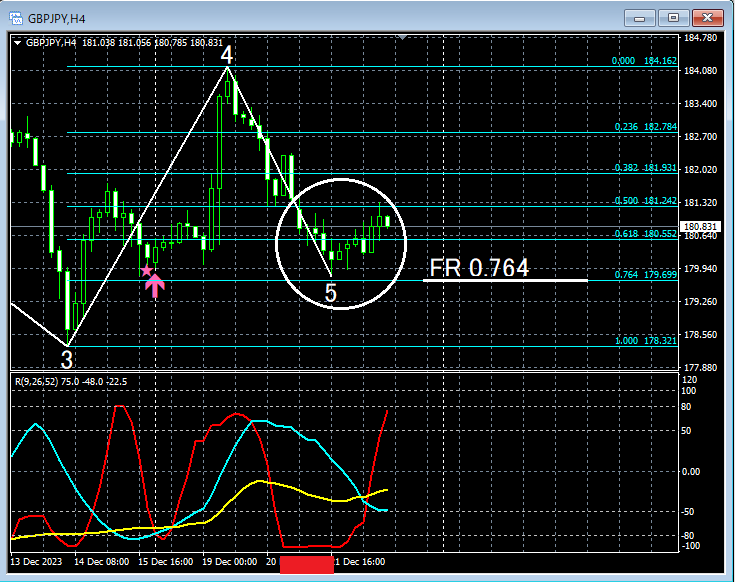
Looking at the 4-hour above,Elliott Wave’s4th wave ascent midwaymBDSR (RCI two-filter) pullback buy signal is lit. If you look at the area circled in white, in the subsequent5th wave and the decline assumed,Fibonacci retracement 76.4% is reached. Also, the short-term RCI, RCI9, is stuck near the bottom (around the red box). If there are signs of upside on the lower timeframe, a dip-buying opportunity may not be unreasonable.
GBP/JPY 1-hour
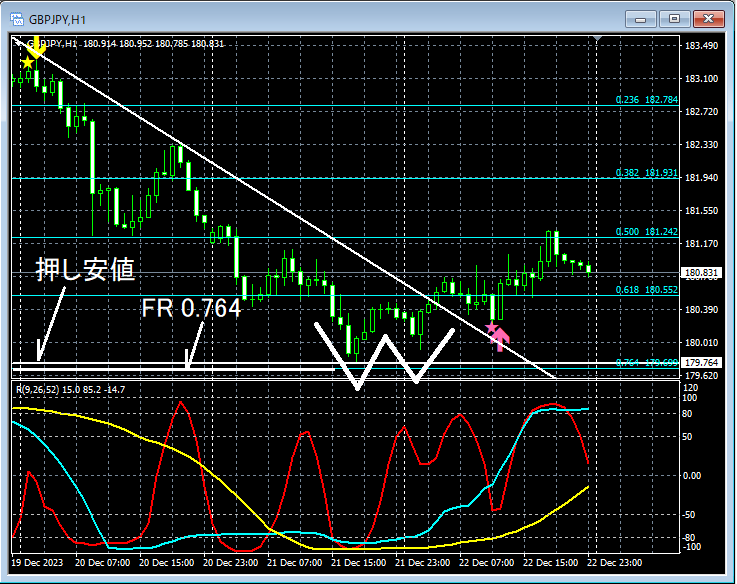
Looking at the 1-hour above, within the early stage of the decline assumed as the 5th wave of the 4-hourElliott Wave,5th wave,mBDSR (RCI two-filter) pullback sell signal is lit.Fibonacci retracement 76.4% andsupport (Dow theory) vicinity are reached,RCI triple bottom forms (around the green square). Then, a rebound occurs.Double bottom forms and risescounter-trend line is broken upward. Then, a little decline occurs andmBDSR (RCI two-filter) pullback buy signal lights up again and price rises.
From this example,RCI 3-line andmBDSR signals andElliott Wave andvarious trading methods (reversal lines, double tops, double bottoms, Fibonacci retracement, Dow theory, counter-trend lines) show high compatibility.
Indicator that delivers power when combined with RCI【BODSOR・mBDSR】
Methods, case studies (PDF) ★GogoJungle AWARD2020 winner★
https://www.gogojungle.co.jp/tools/indicators/11836
The PDF file includes 283 items.
Many of them are examples that break down how to logically link higher and lower timeframes using the 3-RCI lines, sequentially considering the conditions of multiple lower timeframes, and ultimately waiting for the timing to buy on dips or sell on rallies on the lower timeframe (i.e., mBDSR signals).
Also,many focus on capturing points where multiple entry reasons overlap.
In the explanations,more than 1,000 chartsare used.

× ![]()


