

Past lines that have functioned as resistance and the MBDSR (RCI2 two-filter) pullback buying signal
Indicator that shines when used with RCI: 【BODSOR・mBDSR】
Methods and Case Studies (PDF) ★GogoJungle AWARD 2020 winner★
https://www.gogojungle.co.jp/tools/indicators/11836
The PDF file includes 283 items.
Many of them are examples that break down how to logically link higher and lower timeframes using three RCI lines, sequentially consider the conditions of multiple lower timeframes, and finally wait for the timing of pullbacks buying or pullbacks selling on the lower timeframe (the signal of mBDSR).They are.
Also,many focus on capturing points where multiple entry reasons overlap.
In the explanations,more than 1,000 chartsare used.

In recent Investor Navi+ articles,examples focusing on the high compatibility between various trading methods and mBDSR signalsare presented.
AUDUSD 4-hour chart
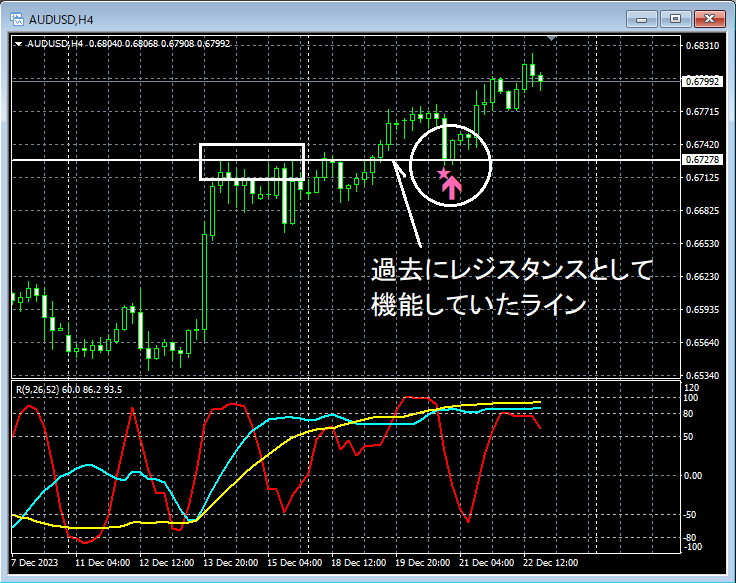
If you look at around the area circled in white on the upper 4-hour chart,you can see that it has fallen to a level that previously acted as resistancenearby.From a support-turned-resistance reversalit may be reasonable to expect a rise.
In such a situation,the mBDSR pullback buy signal (Filter: RCI26 and RCI52)lights up, and price subsequently rises smoothly.
From this example,the high synergy between a trading method focused on lines that previously acted as resistanceandis evident.
Indicator that shines when used with RCI: 【BODSOR・mBDSR】
Methods and Case Studies (PDF) ★GogoJungle AWARD 2020 winner★
https://www.gogojungle.co.jp/tools/indicators/11836
The PDF file includes 283 items.
Many of them are examples that break down how to logically link higher and lower timeframes using three RCI lines, sequentially consider the conditions of multiple lower timeframes, and finally wait for the timing of pullbacks buying or pullbacks selling on the lower timeframe (the signal of mBDSR).They are.
Also,many focus on capturing points where multiple entry reasons overlap.
In the explanations,more than 1,000 chartsare used.
× ![]()


