

The neckline of the double top and the sign of mBDSR (RCI2 two-filter)
Indicator that shines in combination with RCI【BODSOR・mBDSR】
Method and Case Studies (PDF) ★GogoJungle AWARD 2020 winner★
https://www.gogojungle.co.jp/tools/indicators/11836
283 PDF files are included.
Many of them are examples that detail a form in which, by using three RCI lines to logically link higher and lower timeframes, the状況 of multiple lower timeframes are examined sequentially, and finally, in the lower timeframe, the timing of pullbacks to buy or pullbacks to sell (i.e., mBDSR signals) is awaited..
Also,many focus on identifying points where multiple entry reasons coincide.
In the explanations,more than 1,000 chartsare used.

In recent Investor Navi+ articles,examples highlighting the high compatibility between various trading techniques and mBDSR signalsare introduced.
USDCAD Daily
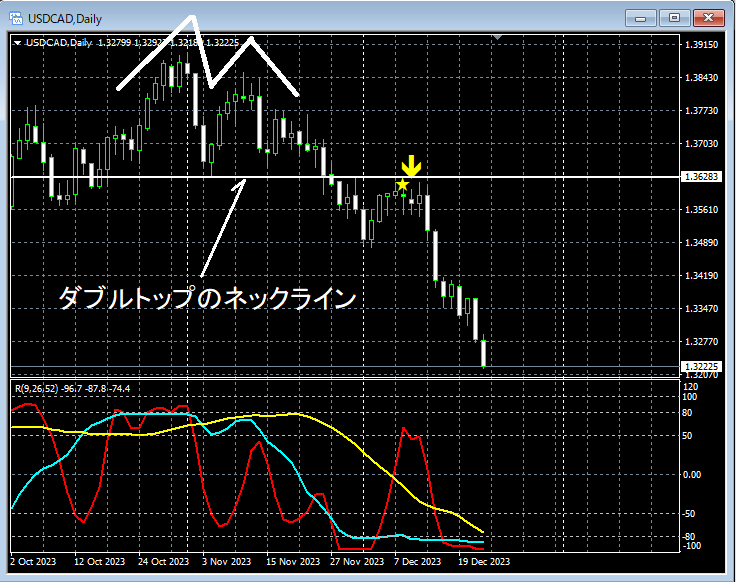
Neckline of the double toprises to near themBDSR (filter: RCI26 and RCI52) sell signallights up and then falls.
From this example,a trading method focused on the neckline of the double topandthe signal of mBDSRshow strong compatibility.
Indicator that shines in combination with RCI【BODSOR・mBDSR】
Method and Case Studies (PDF) ★GogoJungle AWARD 2020 winner★
shttps://www.gogojungle.co.jp/tools/indicators/11836
283 PDF files are included.
Many of them are examples that detail a form in which, by using three RCI lines to logically link higher and lower timeframes, the状況 of multiple lower timeframes are examined sequentially, and finally, in the lower timeframe, the timing of pullbacks to buy or pullbacks to sell (i.e., mBDSR signals) is awaited.Also,
many focus on identifying points where multiple entry reasons coincide.
In the explanations,more than 1,000 chartsare used.
× ![]()


