

Line indicating past notable lows and the signs of the head-and-shoulders and mBDSR (RCI two-filter)
0
An indicator that shines when combined with RCI: BODSOR・mBDSR
Methods and Case Studies (PDF) ★GogoJungle AWARD 2020 Winner★
https://www.gogojungle.co.jp/tools/indicators/11836
The PDF file is attached with 283 items.
Most of them are examples that dissect the situations of multiple lower timeframes by logically linking the higher and lower timeframes using three RCI lines, and ultimately waiting for the timing of pullbacks or retracements on the lower timeframe (the mBDSR signal)..
In addition,many focus on identifying points where multiple entry reasons overlap.There are many.
The explanations usemore than 1,000 charts..

In recent Investment Navi+ articles,examples showing the high compatibility between various trading methods and the mBDSR signalsare introduced as the main focus.
EUR/JPY 4-hour chart
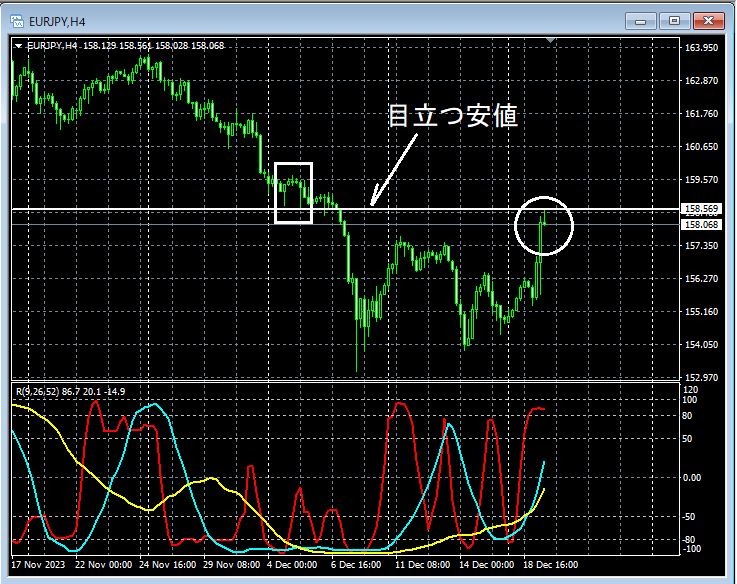
If you look at the area surrounded by a white circle on the daily chart above,you can see a conspicuous lowrising close to that area. It may not be unusual to consider a slight pullback.
EUR/JPY 15-minute chart
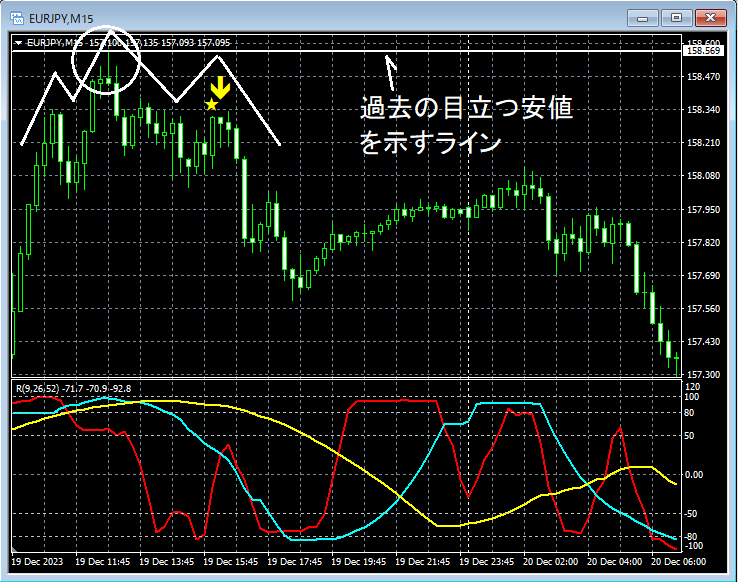
On the upper 15-minute chart,a line showing a past notable lowrises near that line and appears to rebound. Then on the ensuing retrace,the mBDSR (Filter: RCI26 and RCI52) retrace sell signallights up, and price subsequently declines smoothly.
As a result,the right shoulder of the Head-and-Shoulders patternappears to bethe mBDSR retrace sell signallighting up and price moving down. Pay attention to this.
Below, rather than waiting for the 15-minute signal, consider examining the area circled with a white circle on the upper 15-minute chart on the lower timeframe.
EUR/JPY 1-minute chart
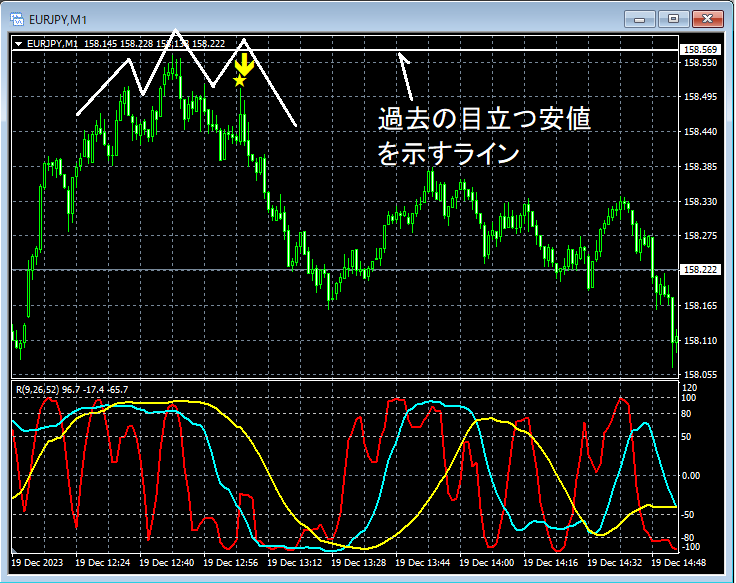
On the upper 1-minute chart,a line showing a past notable lowrises toward that area and seems to rebound. Then on the ensuing retrace,the mBDSR (Filter: RCI26 and RCI52) retrace sell signallights up, and price declines smoothly thereafter.
As a result,the right shoulder of the Head-and-Shoulders patternlights up with themBDSR retrace sell signaland price declines. On the 15-minute chart,the middle peak of the head and shoulderson the 1-minute chart forms awhich is interesting.
From this example,the high compatibility between trade methods that focus on notable lows and head-and-shoulders,andthe signals of mBDSRis evident.
An indicator that shines when combined with RCI【BODSOR・mBDSR】
Methods and Case Studies (PDF) ★GogoJungle AWARD 2020 Winner★
https://www.gogojungle.co.jp/tools/indicators/11836
The PDF file is attached with 283 items.
Most of them are examples that dissect the situations of multiple lower timeframes by logically linking the higher and lower timeframes using three RCI lines, and ultimately waiting for the timing of pullbacks or retracements on the lower timeframe (the mBDSR signal)..
In addition,many focus on identifying points where multiple entry reasons overlap.There are many.
The explanations usemore than 1,000 charts..
× ![]()


