

Sign of the lower-timeframe Elliott Wave, the three-line RCI on the higher timeframe, and mBDSR (RCI two-line filter)
0
An indicator that demonstrates power when combined with RCI【BODSOR・mBDSR】
and methods / case studies (PDF) ★GogoJungle AWARD2020 winner★
https://www.gogojungle.co.jp/tools/indicators/11836
283 PDF files are included.
Many of them are examples that have been distilled into a form where, by logically linking the higher and lower timeframes using three RCI lines, the situations of multiple lower timeframes are sequentially examined, and ultimately the timing of buying on dips or selling on rallies on the lower timeframe (the mBDSR signal) is waited for..
Also,many focus on identifying points where multiple entry reasons converge..
The explanations usemore than 1,000 charts..

In recent Investor Navi+ articles,we showcase examples that illustrate the high compatibility of various trading methods with the mBDSR signal.
GBPUSD 1-hour chart
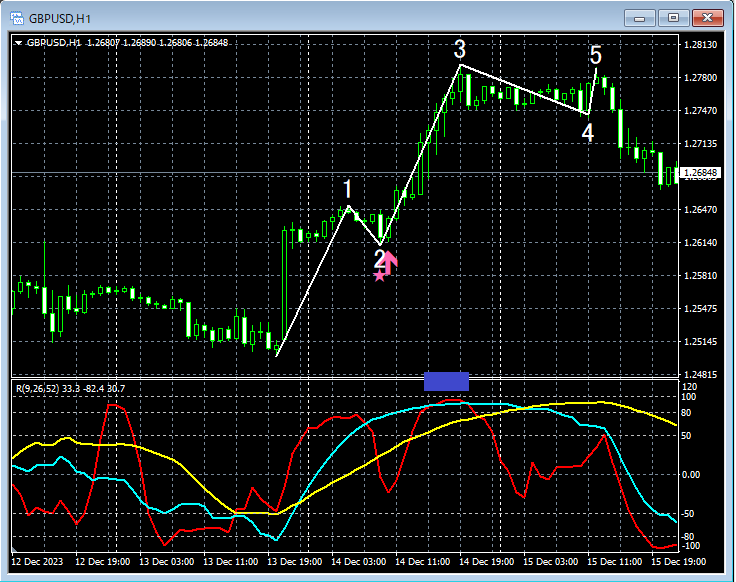
The chart above is on the 1-hour timeframe, but displays theElliott Waveon the 5-minute timeframe. Looking at the 1-hour chart above, you can see that as theupward third wavebegins, the 1-hourmBDSR (filter: RCI26 and RCI52) dip-buy signallights up. Also, at the end of the 5-minuteupward third wavethe 1-hour chart has risen to theRCI double topshape (near the blue square).
From this example,Elliott Waveandthree-line RCIandmBDSR signalsshow a strong harmony.
An indicator that demonstrates power when combined with RCI【BODSOR・mBDSR】
and methods / case studies (PDF) ★GogoJungle AWARD2020 winner★
https://www.gogojungle.co.jp/tools/indicators/11836
283 PDF files are included.
Many of them are examples that have been distilled into a form where, by logically linking the higher and lower timeframes using three RCI lines, the situations of multiple lower timeframes are sequentially examined, and ultimately the timing of buying on dips or selling on rallies on the lower timeframe (the mBDSR signal) is waited for..
Also,many focus on identifying points where multiple entry reasons converge..
The explanations usemore than 1,000 charts..
× ![]()


