

Yesterday’s USD/JPY: Rebound selling at EMA200 and trend reversal (signals of mBDSR and R1R2S2)
Indicator "BODSOR・mBDSR" that demonstrates power when combined with RCI
Method and Case Study (PDF) ★GogoJungle AWARD2020 Winner★
https://www.gogojungle.co.jp/tools/indicators/11836
The PDF file includes 283 items.
Many of them are examples that have been distilled into a form where, by logically linking the higher time frame and lower time frames using three RCI lines, the situations of multiple lower time frames are examined sequentially, and ultimately waiting for buy-the-dips or sell-the-rallies signals on the lower time frames (i.e., the mBDSR signal)..
In addition,there are many that emphasize catching points where multiple entry reasons converge..
In the explanations,more than 1,000 chartsare used.

※【R1R2S2】is included in the above product.
※【R1R2S2】for detailed explanationhere.
In recent Investor Navigator+ articles,we mainly introduce examples that show the high compatibility between various trading methods and the signals of mBDSR and R1R2S2..
USD/JPY 1-hour chart
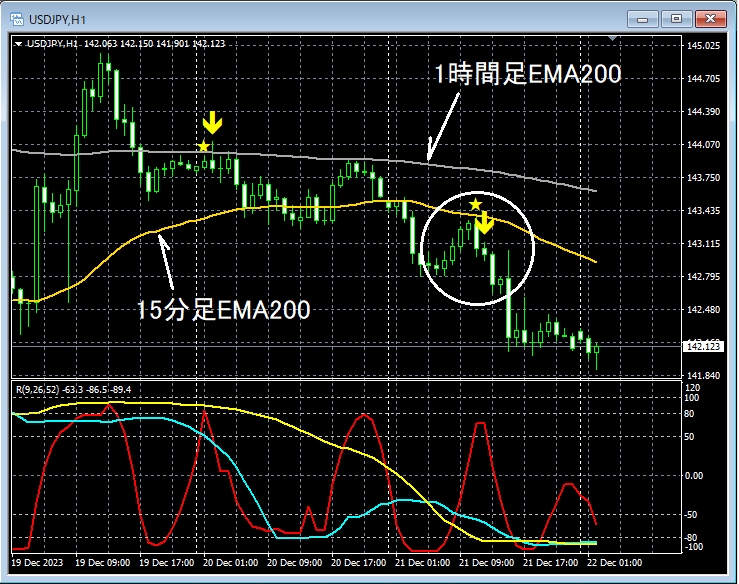
In the upper 1-hour chart, firstthe 1-hour EMA200nearbymBDSR (filters: RCI26 and RCI52) sell-the-rally signallights up and prices move down. Then on the subsequent pullback,the 15-minute EMA200nearbymBDSR (filters: RCI26 and RCI52) sell-the-rally signallights up and prices move down.
Here, we will look more closely at the area circled in white on the lower time frame.
USD/JPY 5-minute chart
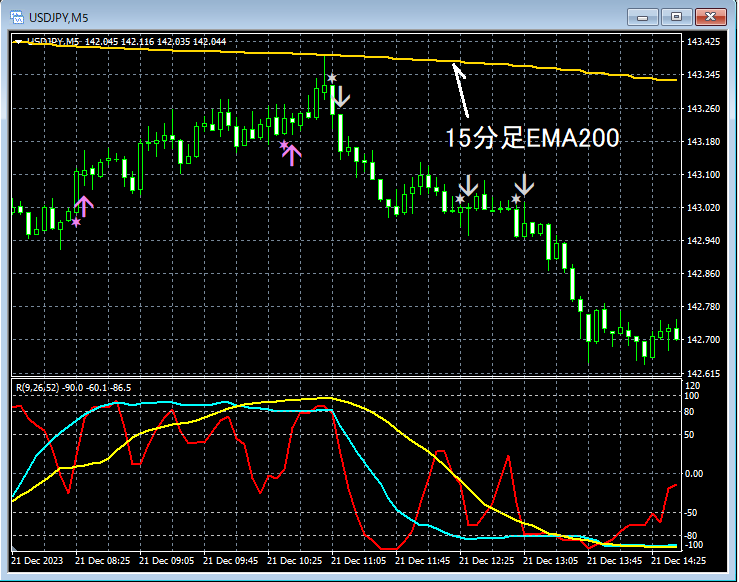
On the upper 5-minute chart, as a result, around highs there are several occurrences wherethe R1R2S2 buy-the-dips signal and sell-the-rally signallight up. It shows that the timing of trend reversals can be captured well.
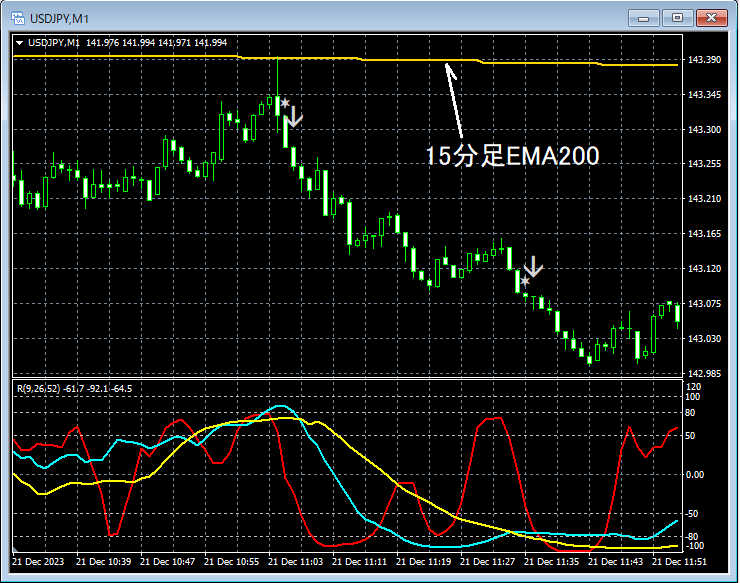
On the upper 1-minute chart, as a result, after hitting a high,R1R2S2 and the sell-the-rally signallight up twice. Note that the first sell-the-rally signal lights up earlier than in the 5-minute chart. It shows that the timing of trend reversals can be captured well.
From this example,a trading method focused on moving averagesandthe signals of mBDSRandR1R2S2show a strong compatibility.
Indicator that excels when combined with RCI【BODSOR・mBDSR】
with method and case studies (PDF) ★GogoJungle AWARD2020 Winner★
https://www.gogojungle.co.jp/tools/indicators/11836
The PDF file includes 283 items.
Many of them are examples that have been distilled into a form where, by logically linking the higher time frame and lower time frames using three RCI lines, the situations of multiple lower time frames are examined sequentially, and ultimately waiting for buy-the-dips or sell-the-rallies signals on the lower time frames (i.e., the mBDSR signal)..
In addition,there are many that emphasize catching points where multiple entry reasons converge..
In explanations,more than 1,000 chartsare used.
× ![]()


