

Parallel channels and lines that have acted as support in the past and the sign of mBDSR (RCI2 two-filter)
Indicator that shines when combined with RCI: BODSOR・mBDSR
Methods and Case Studies (PDF) ★GogoJungle AWARD 2020 Winner★
https://www.gogojungle.co.jp/tools/indicators/11836
The PDF file includes 283 items.
Many of them are summarized as examples that logically link the higher and lower timeframes using 3 RCI lines, sequentially considering the conditions of multiple lower timeframes, and ultimately waiting for the timing to buy on dips or sell on rallies on the lower timeframe (the mBDSR signal)..
Also,many focus on capturing points where multiple entry reasons overlap..
In the explanations,more than 1,000 chartsare used.

In recent Investor Navigator+ articles,we showcase examples that highlight the high compatibility between various trading methods and the mBDSR signals.
AUDCAD 1-hour chart
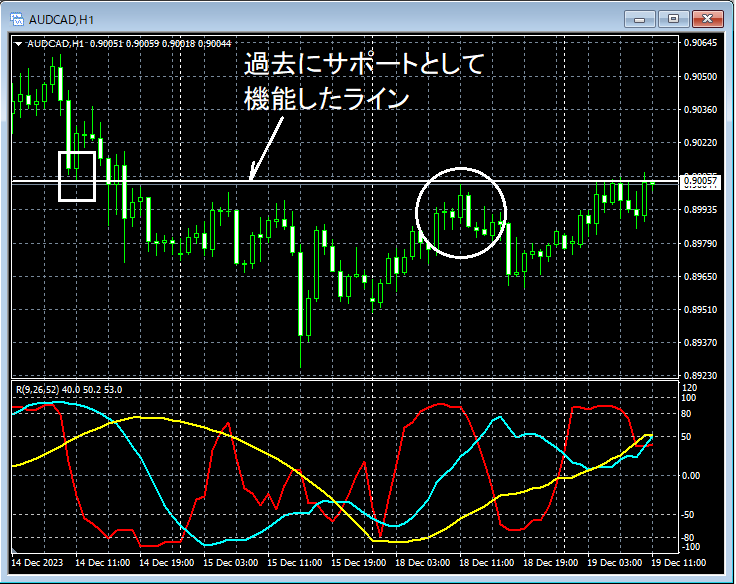
If you look at around the area circled with white on the hourly chart above,you can see that it rose up to a line that previously acted as support.It may be reasonable to consider a drop from a support-turned-resistance.
AUDCAD 15-minute chart
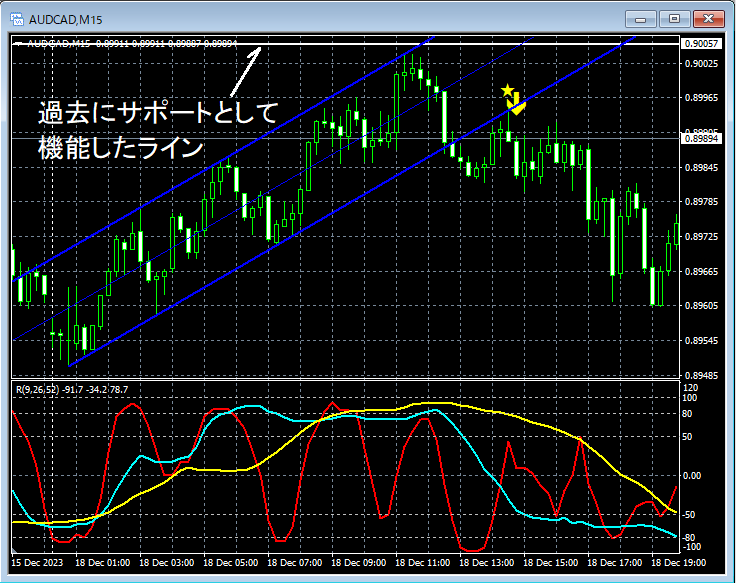
On the 15-minute chart above,the line that previously acted as supportandthe upper boundary of the parallel channel (upward channel)overlapped near the point where the price rose and then reversed. Furthermore,the price broke below the lower bound of the rising channel, andreturned close to the lower bound of the rising channel,the mBDSR (filter: RCI26 and RCI52) sell signallit up, and thereafter the price declined steadily.
From this example,it is clear that a trading method focused on parallel channelsandtrading methods focusing on past support linesandthe mBDSR signalsshow high compatibility.
Indicator that shines when combined with RCI【BODSOR・mBDSR】
Methods and Case Studies (PDF) ★GogoJungle AWARD 2020 Winner★
https://www.gogojungle.co.jp/tools/indicators/11836
The PDF file includes 283 items.
Many of them are summarized as examples that logically link the higher and lower timeframes using 3 RCI lines, sequentially considering the conditions of multiple lower timeframes, and ultimately waiting for the timing to buy on dips or sell on rallies on the lower timeframe (the mBDSR signal)..
Also,many focus on capturing points where multiple entry reasons overlap..
In the explanations,more than 1,000 chartsare used.
× ![]()


