

Elliott Wave Upward Impulse Wave 5 and mbDSR (RCI dual filter) Buy-the-Dip Signal and Double Bottom
0
An indicator that shines in combination with RCI【BODSOR・mBDSR】
Methods and Case Studies (PDF) ★GogoJungle AWARD 2020 Winner★
https://www.gogojungle.co.jp/tools/indicators/11836
The PDF file includes 283 items.
Many of them are summarized as examples that logically link higher and lower timeframes using the RCI three-line method, progressively considering the situation of multiple lower-timeframes, and ultimately waiting for a timing to buy on dips or sell on rallies on the lower timeframe (the mBDSR signal)..
Also,many focus on capturing points where multiple entry reasons overlap.
In the explanations,more than 1,000 chartsare used.

In recent Investor Navi+ articles,we introduce examples that illustrate the high compatibility between various trading methods and the mBDSR signals.
Dollar/Yen 5-minute chart
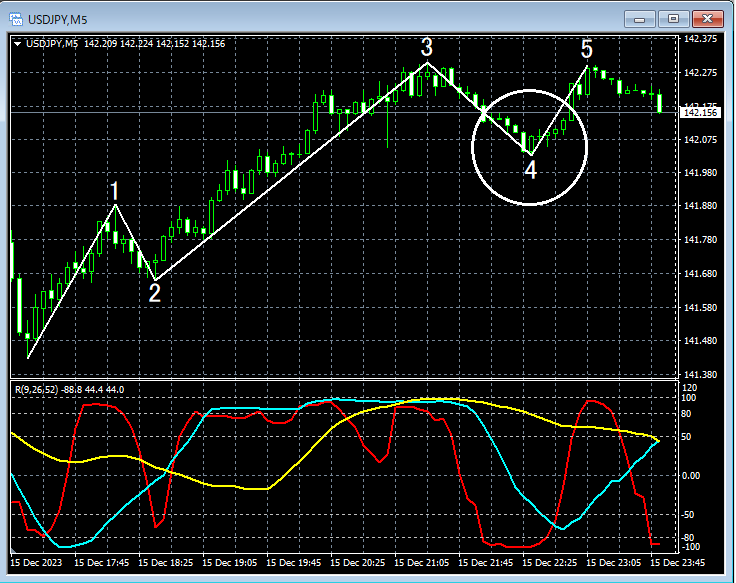
On the upper 5-minute chart, the lower-timeframe 1-minute Elliott Waveis displayed. If you look at the area encircled by a white circle,Wave 4has endedWave 5may be starting. While watching where the reversal might occur, it could also be a scene where you consider buying on dips on the 1-minute lower timeframe.
Dollar/Yen 1-minute chart
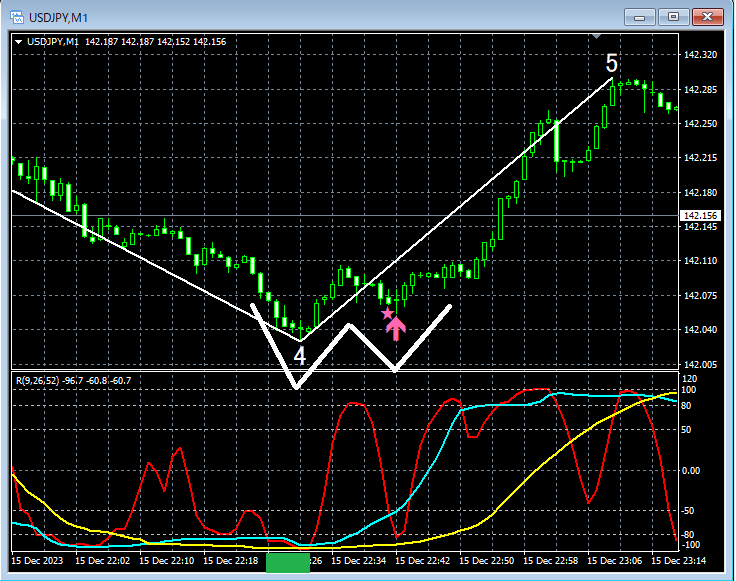
On the upper 1-minute chart, if you look around the green square area, it has fallen to a so-calledRCI triple bottomshape.RCI triple bottomtoshort-term RCIcalledRCI9rises and then falls,mBDSR (filter: RCI26 and RCI52) dip-buy signallights up, and subsequently prices rise steadily. Consequently,Elliott WaveshowsWave 4has endedWave 5is beginning.
At this time,Double Bottom’s right-side valleymBDSR (filter: RCI26 and RCI52) dip-buy signallights up and price rises, forming an upward movement.
From this example,Elliott Waveandtrading methods focused on the Double BottomandmBDSR signalsshow a strong compatibility.
Also, in this example,placing a stop-loss slightly below the recent lowenableshigh risk-reward trades.
Indicator that shines in combination with RCI【BODSOR・mBDSR】
Methods and Case Studies (PDF) ★GogoJungle AWARD 2020 Winner★
https://www.gogojungle.co.jp/tools/indicators/11836
The PDF file includes 283 items.
Many of them are summarized as examples that logically link higher and lower timeframes using the RCI three-line method, progressively considering the situation of multiple lower-timeframes, and ultimately waiting for a timing to buy on dips or sell on rallies on the lower timeframe (the mBDSR signal)..
Also,many focus on capturing points where multiple entry reasons overlap.
In the explanations,more than 1,000 chartsare used.
× ![]()


