

RCI3 The single-line downtrend theory, pullback high, counter-trend line, and mBDSR signal
Indicator that shows power in combination with RCI【BODSOR・mBDSR】
and methods/case studies (PDF) ★GogoJungle AWARD2020 winner★
https://www.gogojungle.co.jp/tools/indicators/11836
The PDF file includes 283 items.
Many of them are examples that have been condensed to the form of logically linking higher and lower timeframes using 3-line RCI, sequentially considering the状況 of multiple lower timeframes, and finally waiting for pullback buying or selling timing on the lower timeframe (=mBDSR signal)..
Also,many focus on capturing points where multiple entry justification overlap..
In the explanations,more than 1,000 chartsare used.

In recent Investor Navigation+ articles,we introduce mainly examples that show the high compatibility between various trading methods and mBDSR signals.
EURUSD 1-hour chart
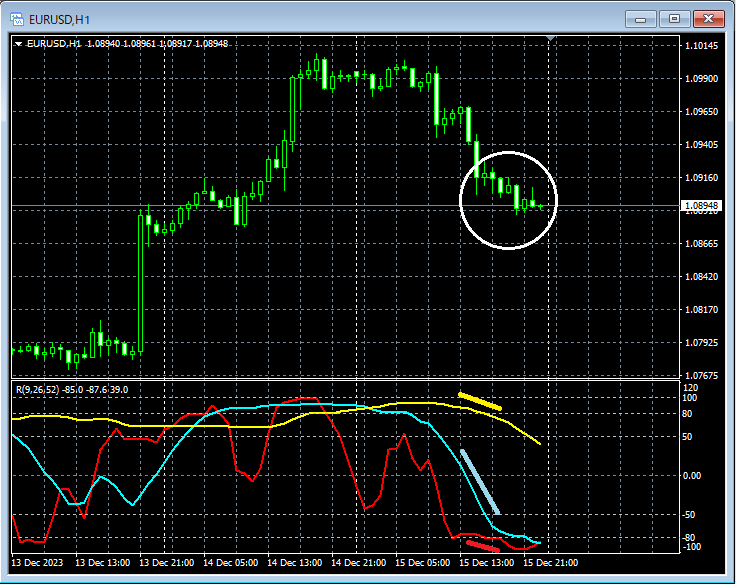
If you look at around the area circled in white on the 1-hour chart above,three RCI linesare aligned in a way that indicates a very weak downward movement. Note that the chart is omitted, but on the lower timeframe, the 15-minute and 5-minute chartsDow Theoryindicate a downtrend. Furthermore, on the lower timeframe 1-minute chart, it might also be reasonable to consider selling on rallies.
EURUSD 1-minute chart
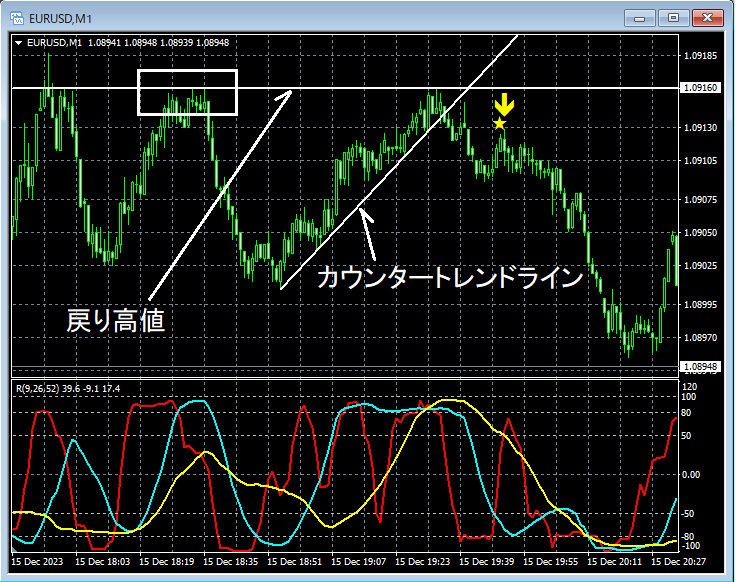
On the 1-minute chart above,the retracement highcannot be surpassed and a decline occurs.Counter-trend lineAfter breaking below, with the risemBDSR (filter: RCI26 and RCI52) pullback selling signallights up, and afterward, the price decreases a bit.
From this example,Dow Theoryandtrading methods focusing on counter-trend linesandmBDSR signalsshow high compatibility.
Indicator that shows power in combination with RCI【BODSOR・mBDSR】
and methods/case studies (PDF) ★GogoJungle AWARD2020 winner★
https://www.gogojungle.co.jp/tools/indicators/11836
The PDF file includes 283 items.
Many of them are examples that have been condensed to the form of logically linking higher and lower timeframes using 3-line RCI, sequentially considering the状況 of multiple lower timeframes, and finally waiting for pullback buying or selling timing on the lower timeframe (=mBDSR signal)..
Also,many focus on capturing points where multiple entry justification overlap..
In the explanations,more than 1,000 chartsare used.
× ![]()


