

Crude Oil Futures (WTI): Reversal of resistance-support turning line and mBDSR (RCI with 2 filters) sell signal
0
Indicator that shines when used with RCI: 【BODSOR・mBDSR】
Methods and Case Studies (PDF) ★GogoJungle AWARD 2020 Winner★
https://www.gogojungle.co.jp/tools/indicators/11836
A PDF file with 283 items is included.
Many of them are examples that break down how to logically link higher and lower timeframes using the 3-line RCI, sequentially examine the conditions of multiple lower timeframes, and ultimately wait for a timing to buy on dips or sell on rallies on the lower timeframe (the mBDSR signal)..
Also,many focus on capturing points where multiple entry reasons overlap.
In the explanations,more than 1,000 chartsare used.

In a recent Investor Navi+ article,highlighting the high compatibility between various trading methods and the mBDSR signalsis shown with examples.
Crude Oil Futures WTI 4-hour
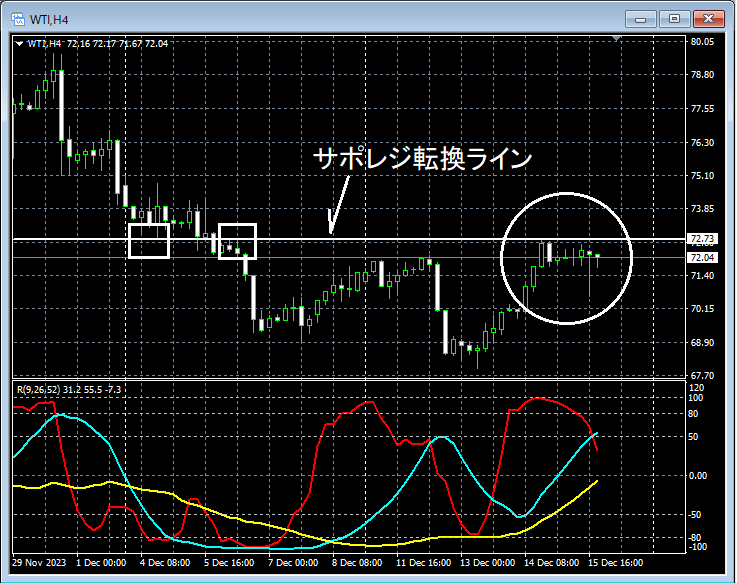
If you look at the area circled in white on the 4-hour chart above,you can see it rising toward the support-resistance reversal linearound that area.Support-Resistance Reversal Lineand it may be slightly pulled back from there, which is not surprising.
Crude Oil Futures WTI 1-hour
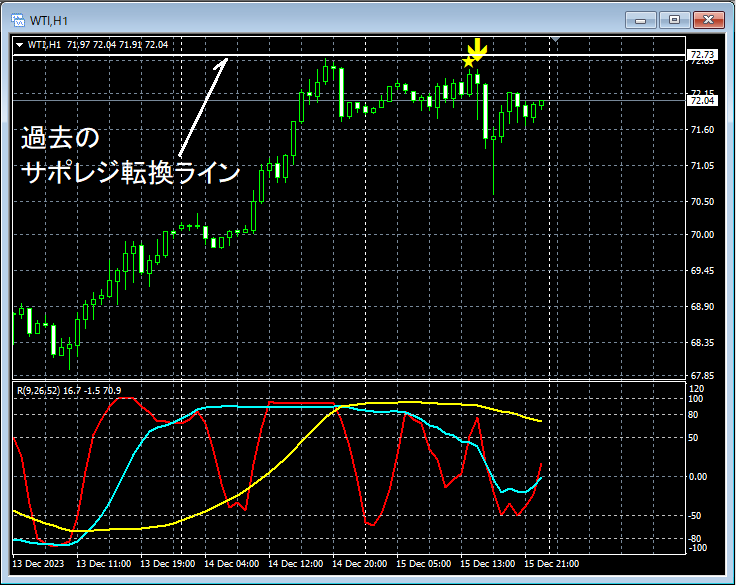
On the 1-hour chart above,you cannot exceed the past support-resistance reversal lineandthe mBDSR (Filter: RCI26 and RCI52) pullback sell signallights up, after which price moves slightly downward.
From this example,there is a strong synergy between a trade method focused on the support-resistance reversal lineandthe mBDSR signals.
Furthermore, in this example,placing a stop-loss slightly above the recent highandachieving a high risk-reward tradeis possible.
Indicator that shines when used with RCI: 【BODSOR・mBDSR】
Methods and Case Studies (PDF) ★GogoJungle AWARD 2020 Winner★
https://www.gogojungle.co.jp/tools/indicators/11836
A PDF file with 283 items is included.
Many of them are examples that break down how to logically link higher and lower timeframes using the 3-line RCI, sequentially examine the conditions of multiple lower timeframes, and ultimately wait for a timing to buy on dips or sell on rallies on the lower timeframe (the mBDSR signal)..
Also,many focus on capturing points where multiple entry reasons overlap.
In the explanations,more than 1,000 chartsare used.
× ![]()


