

Gold (XAUUSD): A double top, RCI with 3 lines, moving averages, and mBDSR (RCI with 2 lines filter) sell signal
0
Indicator that shines when combined with RCI: BODSOR・mBDSR
Methods, cases studies (PDF) ★GogoJungle AWARD 2020 winner★
https://www.gogojungle.co.jp/tools/indicators/11836
283 PDF files are included.
Most of them are examples that lay out how to logically link higher timeframes and lower timeframes using three RCI lines, and ultimately wait for pullbacks or reversals on the lower timeframes (i.e., the mBDSR signals)..
Also,many focus on capturing points where multiple entry reasons align..
In the explanations,more than 1,000 chartsare used.

In a recent Investors Navi+ article,we highlight examples that show the high compatibility between various trading methods and mBDSR signals..
Gold XAUUSD 1-hour chart
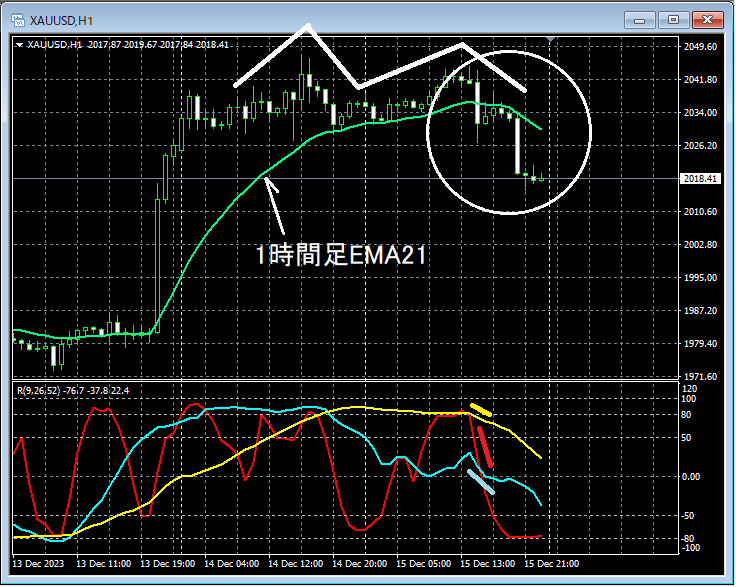
Looking at the area circled by the white circle on the 1-hour chart above,the shape could form the right shoulder of a double top and has broken below the1-hour EMA21 which had been acting as support, and moreoverthe three RCI lines align and trend down, indicating a very weak setup. It may not be unusual to look for a pullback sell on the lower timeframe.
Gold XAUUSD 15-minute chart
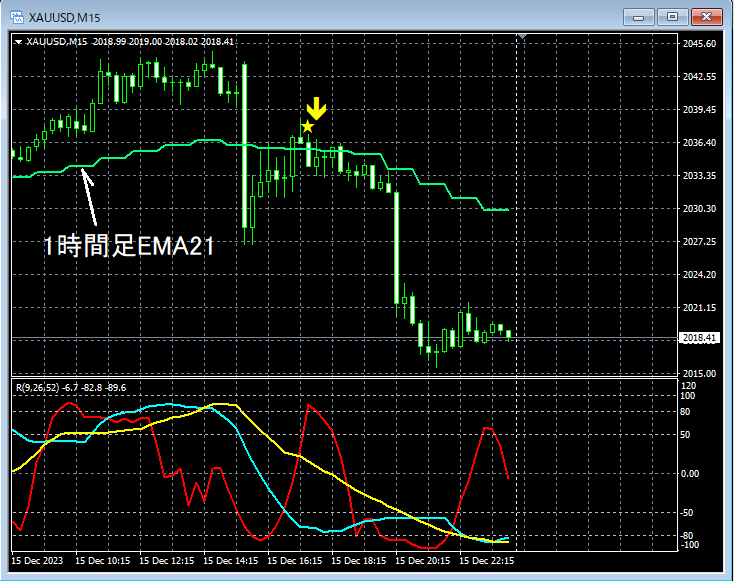
Looking at the 15-minute chart above,the 1-hour EMA21after the decline,mBDSR (filter: RCI26 and RCI52) pullback sell signalslight up, and the price declines smoothly.
From this example,the high compatibility between trading methods that focus on RCI three-line configuration, double tops, and moving averagesandmBDSR signalsis evident.
Indicator that shines when combined with RCI【BODSOR・mBDSR】
Methods, case studies (PDF) ★GogoJungle AWARD 2020 winner★
https://www.gogojungle.co.jp/tools/indicators/11836
283 PDF files are included.
Most of them are examples that lay out how to logically link higher timeframes and lower timeframes using three RCI lines, and ultimately wait for pullbacks or reversals on the lower timeframes (i.e., the mBDSR signals).Also,
many focus on capturing points where multiple entry reasons align..
In the explanations,more than 1,000 chartsare used.

× ![]()


