
Moving average line and mBDSR signals, and the Sakata methods (three-method decline) signals of R1R2S2
An indicator that demonstrates power when combined with RCI: 【BODSOR・mBDSR】
Methods and Case Studies (PDF) ★GogoJungle AWARD 2020 Winner★
https://www.gogojungle.co.jp/tools/indicators/11836
The PDF file contains 283 attachments.
Many of them are examples that break down how to logically link higher and lower timeframes using three RCI lines, sequentially considering the conditions of multiple lower timeframes, and ultimately waiting for a timing to buy on dips or sell on rallies on the lower timeframe (the mBDSR signal)..
Also,many focus on identifying points where multiple entry reasons overlap..
In the explanations,more than 1,000 chartsare used.

※【R1R2S2】is included in the above product.
※【R1R2S2】for detailed explanationhere.
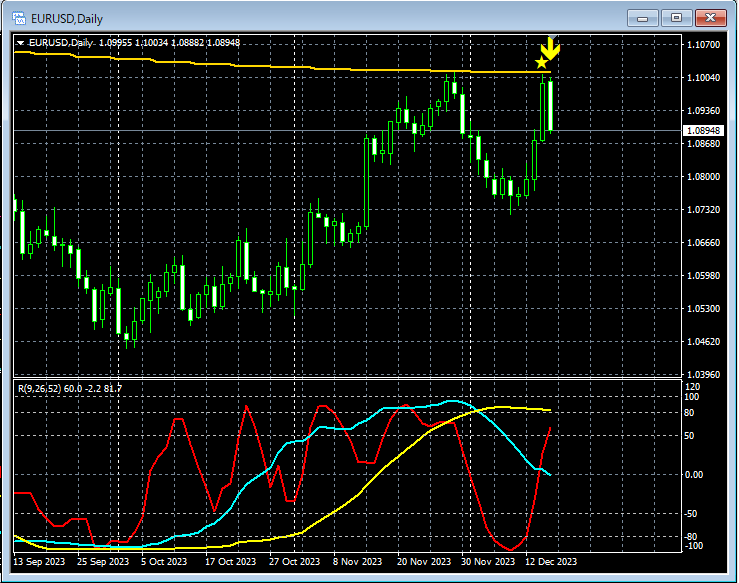
Euro-Dollar Daily
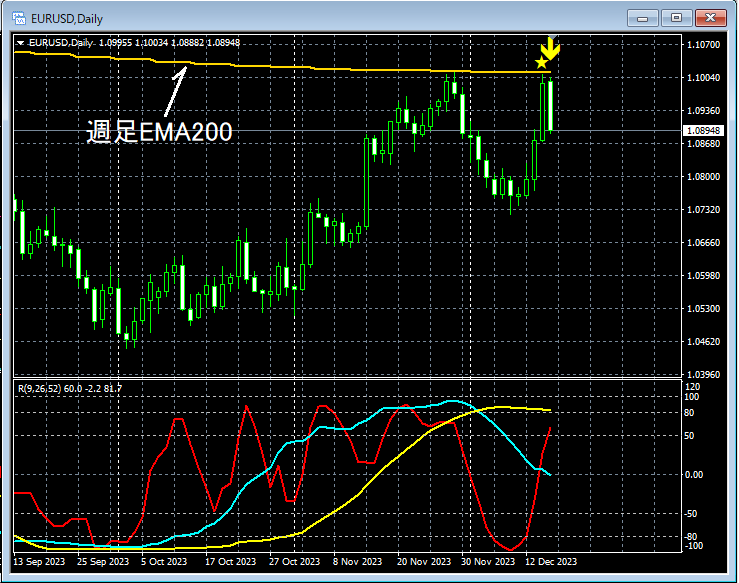
On the daily chart above,mBDSR’s sell-on-rally signalis lit. After rising to thewhich previously acted as resistance, the signal lights up, and it may be reasonable to expect further declines from here. The result is a large bearish candlestick.weekly EMA200
Euro-Dollar 1-hour
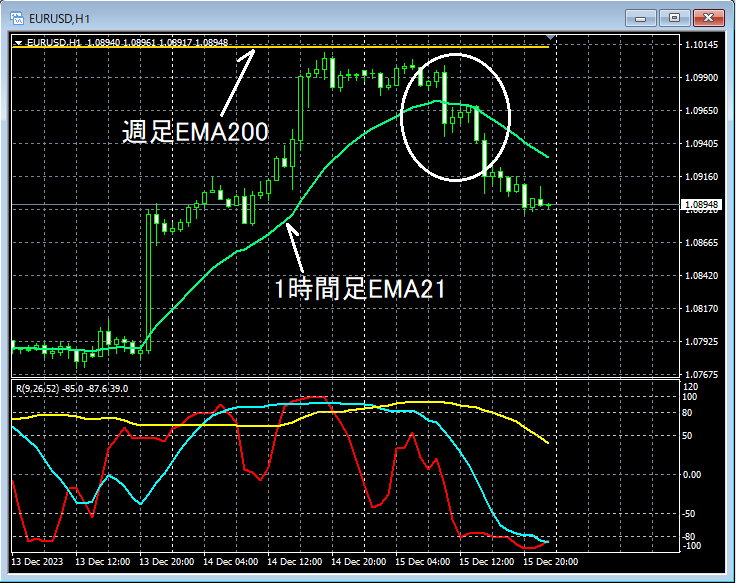
Looking at the area circled in white on the above 1-hour chart,Sakata's Five Methods,Ebbing Three Methodsappear, and considering thatthe 1-hour EMA21acts as resistance, it may also be reasonable to expect further decline.
Euro-Dollar 30-minute
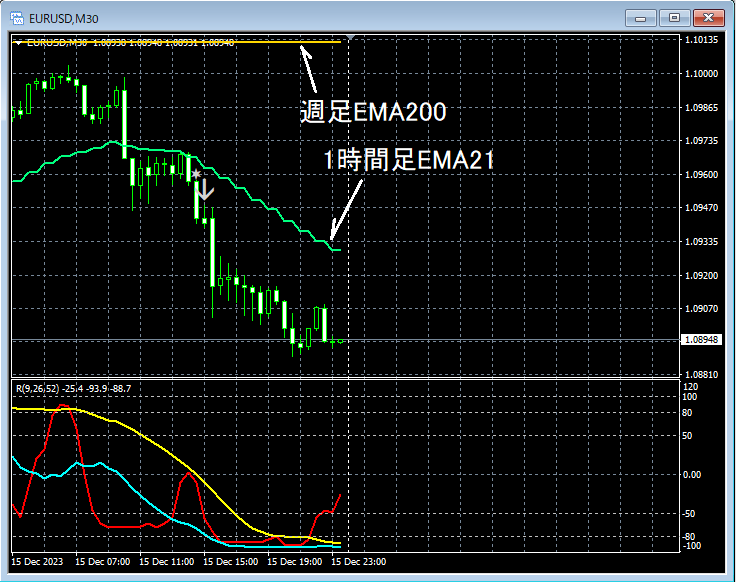
On the 30-minute chart above, after theSakata’s Five Methods’Ebbing Three Methodsappeared on the 1-hour chart, theR1R2S2’s sell-on-rally signallit up, and since then the price has been moving down smoothly.
From this example,trading methods that focus on moving averagesandSakata’s Five Methods (Ebbing Three Methods)andmBDSR signalsandR1R2S2 signalsappear to be highly compatible.
An indicator that shines when combined with RCI: 【BODSOR・mBDSR】
Methods and Case Studies (PDF) ★GogoJungle AWARD 2020 Winner★
https://www.gogojungle.co.jp/tools/indicators/11836
The PDF file contains 283 attachments.
Many of them are examples that break down how to logically link higher and lower timeframes using three RCI lines, sequentially considering the conditions of multiple lower timeframes, and ultimately waiting for a timing to buy on dips or sell on rallies on the lower timeframe (the mBDSR signal)..
Also,many focus on identifying points where multiple entry reasons overlap..
In the explanations,more than 1,000 chartsare used.