

Moving average of the higher timeframe and mBDSR (RCI two-filter) short selling signal
0
Indicator that shines when combined with RCI: 【BODSOR・mBDSR】
and method・case studies (PDF) ★GogoJungle AWARD 2020 winner★
https://www.gogojungle.co.jp/tools/indicators/11836
The PDF file includes 283 items.
Many of them are examples that lay out a form where the higher-timeframe and lower-timeframe are logically linked using three RCI lines, sequentially considering the conditions of multiple lower timeframes, and finally waiting for a timing to buy on dips or sell on rallies on the lower timeframe (i.e., the mBDSR signal)..
Also,many of them focus on capturing points where multiple entry reasons overlap..
In the explanations,more than 1,000 chartsare used.

In recent Investing Navigator+ articles,we introduce examples that show the high compatibility between various trading methods and the mBDSR signs.
AUDUSD 1-hour chart
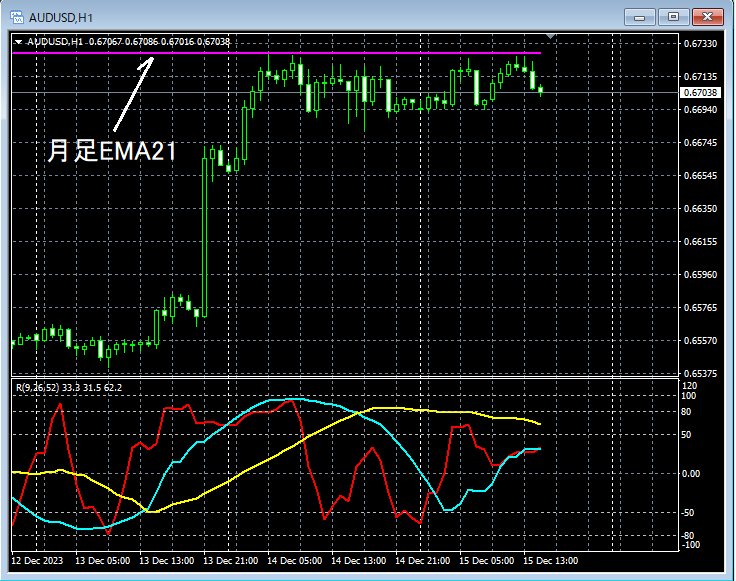
Looking at the 1-hour chart above, recentlythe monthly EMA21acts as resistance. It wouldn’t be surprising if a decline occurs at this point.
AUDUSD 5-minute chart
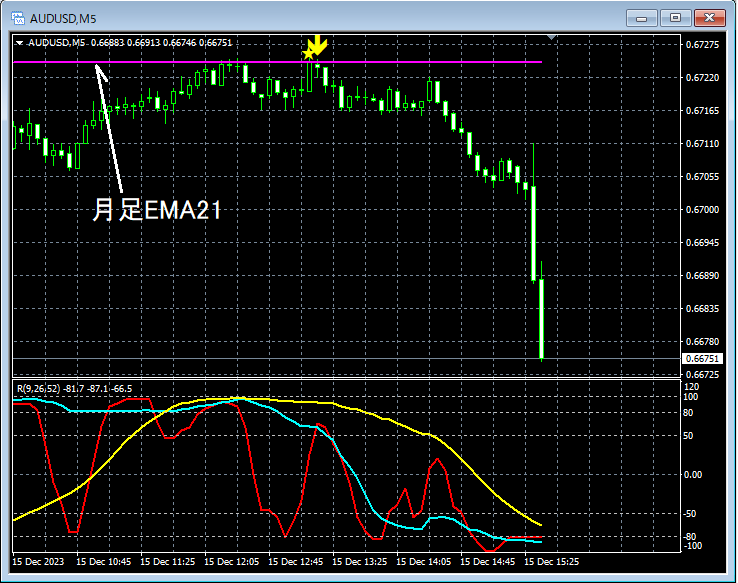
On the 5-minute chart above,mBDSR (filters: RCI26 and RCI52) sell-into-rally signallights up. After that, price continues to fall smoothly.
From this example,the high compatibility between trading methods that focus on the moving average on the higher timeframeandthe mBDSR signalsis evident.
Also, in this example,placing a stop-loss slightly above the recent highandachieving a high risk-reward tradeis possible.
Indicator that shines when combined with RCI: 【BODSOR・mBDSR】
and method・case studies (PDF) ★GogoJungle AWARD 2020 winner★
https://www.gogojungle.co.jp/tools/indicators/11836
The PDF file includes 283 items.
Many of them are examples that lay out a form where the higher-timeframe and lower-timeframe are logically linked using three RCI lines, sequentially considering the conditions of multiple lower timeframes, and finally waiting for a timing to buy on dips or sell on rallies on the lower timeframe (i.e., the mBDSR signal)..
Also,many of them focus on capturing points where multiple entry reasons overlap..
In the explanations,more than 1,000 chartsare used.
× ![]()


