

Moving average of the upper leg and mBDSR (RSI 2-band filter) buying signal
Indicator that shines in combination with RCI【BODSOR・mBDSR】
Methods and Case Studies (PDF) ★GogoJungle AWARD 2020 Winner★
https://www.gogojungle.co.jp/tools/indicators/11836
A PDF file with 283 items is included.
Many of them are examples that have been boiled down to the form of waiting for the timing to buy on dips or sell on rallies on the lower timeframes (the mBDSR signal) by logically linking the higher and lower timeframes using three RCI lines (RCI3-line)..
In addition,many focus on catching points where multiple entry rationales overlap..
In the explanations,more than 1,000 chartsare used.

In recent Investor Navi+ articles,we mainly introduce examples that show the high compatibility between various trading methods and the mBDSR signal.
GBPJPY 4-hour
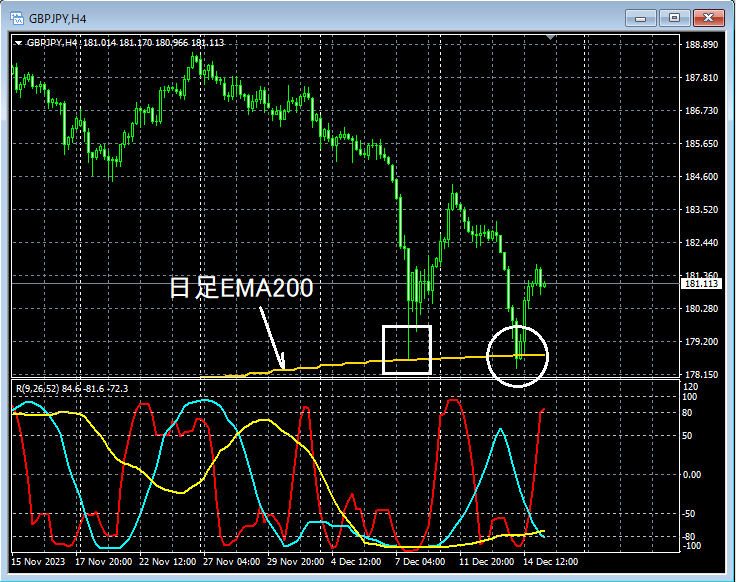
Looking at the area circled in white on the 4-hour chart above, you can see that it has fallen close to theDaily EMA200nearby. It may not be strange to expect a rebound to rise momentarily.
GBPJPY 15-minute
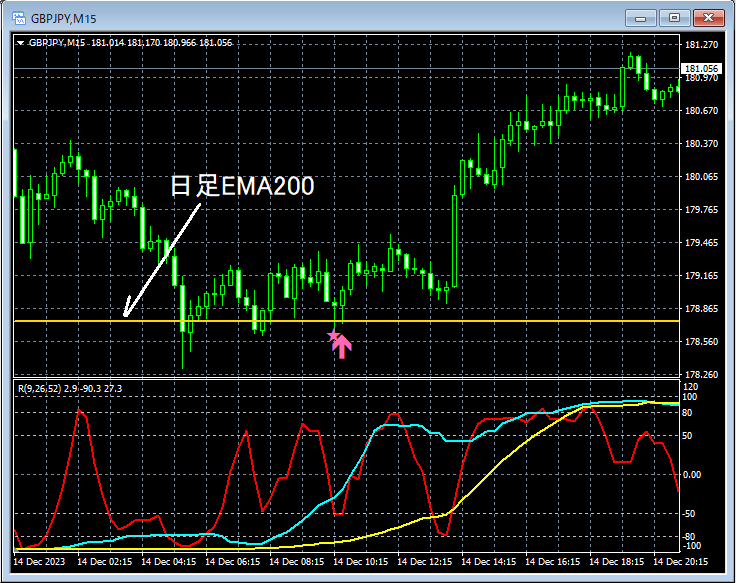
On the 15-minute chart above,Daily EMA200cannot clearly break below,mBDSR (Filter: RCI26 and RCI52) dip-buy signallights up. Subsequently, price has been rising smoothly.
From this example,a high compatibility between a trade method that focuses on the higher timeframe moving averagesandthe mBDSR signalis evident.
Also in this example,placing a stop loss just a little below the recent lowandachieving a high risk-reward tradeis possible.
Indicator that shines in combination with RCI【BODSOR・mBDSR】
Methods and Case Studies (PDF) ★GogoJungle AWARD 2020 Winner★
https://www.gogojungle.co.jp/tools/indicators/11836
A PDF file with 283 items is included.
Many of them are examples that have been boiled down to the form of waiting for the timing to buy on dips or sell on rallies on the lower timeframes (the mBDSR signal) by logically linking the higher and lower timeframes using three RCI lines (RCI3-line)..
In addition,many focus on catching points where multiple entry rationales overlap..
In the explanations,more than 1,000 chartsare used.
× ![]()


