

Backtest of three-line RCI and past support line and counter-trend line and R1 R2 S2 pullback selling signal
0
Indicator that shines in combination with RCI: 【BODSOR・mBDSR】
Methods and Case Studies (PDF) ★GogoJungle AWARD 2020 Winner★
https://www.gogojungle.co.jp/tools/indicators/11836
A PDF file with 283 items is included.
Many of them are examples that lay out a form where the higher and lower timeframes are logically linked using three RCI lines, sequentially considering the conditions of multiple lower timeframes, and ultimately waiting for a buying on dips or selling on rallies on the lower timeframe (i.e., the mBDSR signals)..
Also,many focus on capturing points where multiple entry reasons coincide..
In the explanations,more than 1,000 chartsare used.

※【R1R2S2】is included in the above product.
※【R1R2S2】For detailed explanation,click here.
In recent Invest Navi+ articles,examples focusing on the compatibility between various trading methods and the signals of mBDSR and R1R2S2are introduced to illustrate the high degree of compatibility.
Dollar/Yen 1-hour chart
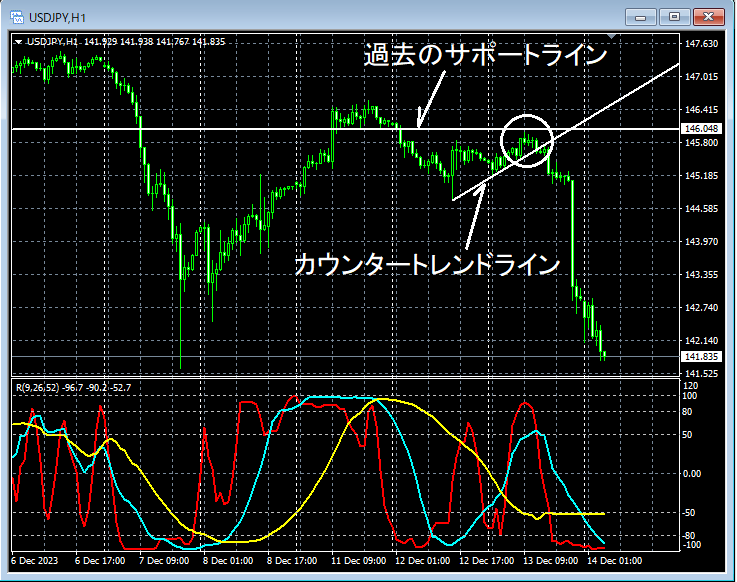
The higher-timeframe chart is omitted, but on the daily chartRCI three-line
Looking at the area circled in white on the 1-hour chart above,past support lineshave risen to around and it might be reasonable to expect a pullback.
Dollar/Yen 15-minute chart
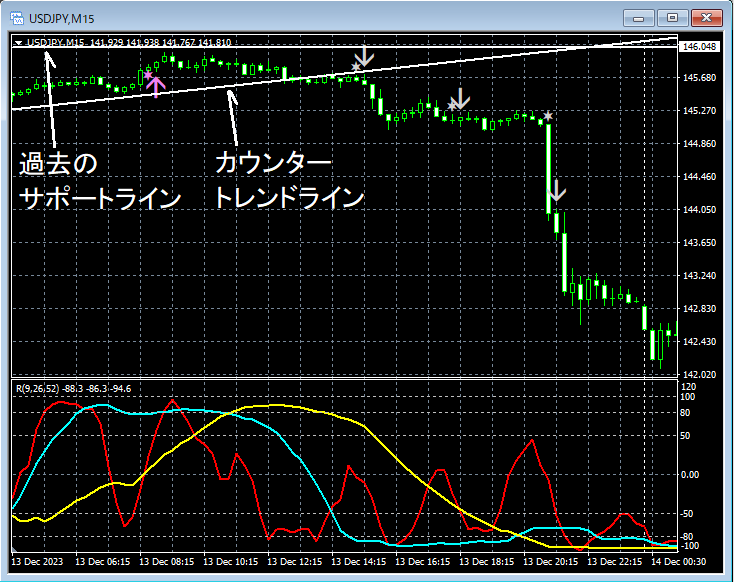
On the upper 15-minute chart,past support linesrise from nearby, and thencounter-trend lineis broken downward, after whichR1R2S2 pullback sell signalslight up, and price then declines steadily. By watching the chart's progression,R1R2S2 pullback sell signalssignal three times in total.
From this example,a trading method that focuses on past support lines and counter-trend linesandtrading method using RCI three linesandthe signals of R1R2S2show a high degree of compatibility.
Indicator that shines in combination with RCI:【BODSOR・mBDSR】
Methods and Case Studies (PDF) ★GogoJungle AWARD2020 Winner★
https://www.gogojungle.co.jp/tools/indicators/11836
A PDF file with 283 items is included.
Many of them are examples that lay out a form where the higher and lower timeframes are logically linked using three RCI lines, sequentially considering the conditions of multiple lower timeframes, and ultimately waiting for a buying on dips or selling on rallies on the lower timeframe (i.e., the mBDSR signals)..
Also,many focus on capturing points where multiple entry reasons coincide..
In the explanations,more than 1,000 chartsare used.

× ![]()


