

Past notable highs and return moves and the mBDSR (two RCI filters) pullback buying signal
0
An indicator that demonstrates its power in combination with RCI【BODSOR・mBDSR】
and methods and case studies (PDF) ★GogoJungle AWARD2020 Winner★
https://www.gogojungle.co.jp/tools/indicators/11836
283 PDF files are included.
Many of them are examples that describe arranging multiple lower timeframes by logically linking higher and lower timeframes using three RCI lines, and finally waiting for pullback buying or pullback selling timing on the lower timeframe (the mBDSR signal)..
Also,many focus on catching points where multiple entry reasons overlap.
In the explanationsmore than 1,000 chartsare used.

In recent Investor Navigator+ articles,examples that show the high compatibility between various trading methods and the mBDSR signalsare introduced focusing on those.
NZDUSD 1-hour chart
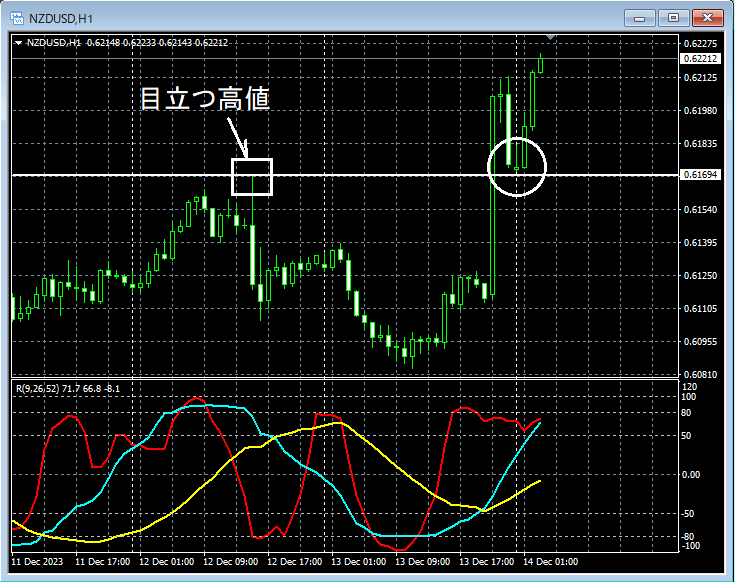
Looking at around the area circled in white on the 1-hour chart above, it often serves as supportnear notable past highs, and it may not be unusual to consider a pullback buy.
NZDUSD 1-minute chart
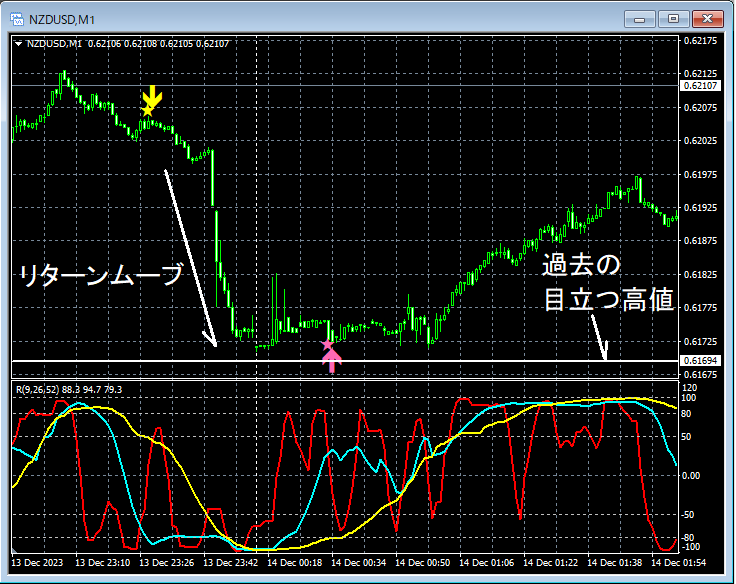
On the upper 1-minute chart, first,return movetonotable past highsnear thosenotable past highsandmBDSR (filters: RCI26 and RCI52) pullback buy signallights up, and price subsequently rises smoothly.
From this example,the high compatibility between return-move- and notable-past-high-focused trading methodsandthe mBDSR signalis evident.
Also, in this example,placing a stop-loss slightly below the most recent lowand so onenables high risk-reward trading.
An indicator that demonstrates its power in combination with RCI【BODSOR・mBDSR】
and methods and case studies (PDF) ★GogoJungle AWARD2020 Winner★
https://www.gogojungle.co.jp/tools/indicators/11836
283 PDF files are included.
Many of them are examples that describe arranging multiple lower timeframes by logically linking higher and lower timeframes using three RCI lines, and finally waiting for pullback buying or pullback selling timing on the lower timeframe (the mBDSR signal)..
Also,many focus on catching points where multiple entry reasons overlap.
In the explanationsmore than 1,000 chartsare used.

× ![]()


