

Recovering-sell signals from the reversal line of the resistance-support, pin bar, head-and-shoulders, and R1R2S2
0
Indicator that shines when combined with RCI【BODSOR・mBDSR】
Method and Case Study (PDF) ★GogoJungle AWARD2020 Winner★
https://www.gogojungle.co.jp/tools/indicators/11836">https://www.gogojungle.co.jp/tools/indicators/11836">https://www.gogojungle.co.jp/tools/indicators/11836https://www.gogojungle.co.jp/tools/indicators/11836
A PDF file with 283 attachments is included.
Many of them are examples that have been distilled into a form where multiple lower timeframes are logically linked with the higher timeframe using 3-line RCI, and ultimately wait for the timing of a pullback buy or a retracement sell on the lower timeframe (the mBDSR signal)..
Also,many focus on capturing points where multiple entry reasons overlap..
In the explanations,more than 1,000 charts are used.

※【R1R2S2】is included in the above product.
※【R1R2S2】For detailed explanation,here.
In recent Investor Navi+ articles,they introduce examples that highlight the high compatibility between various trading methods and the signals of mBDSR and R1R2S2..
EURNZD 4-hour chart
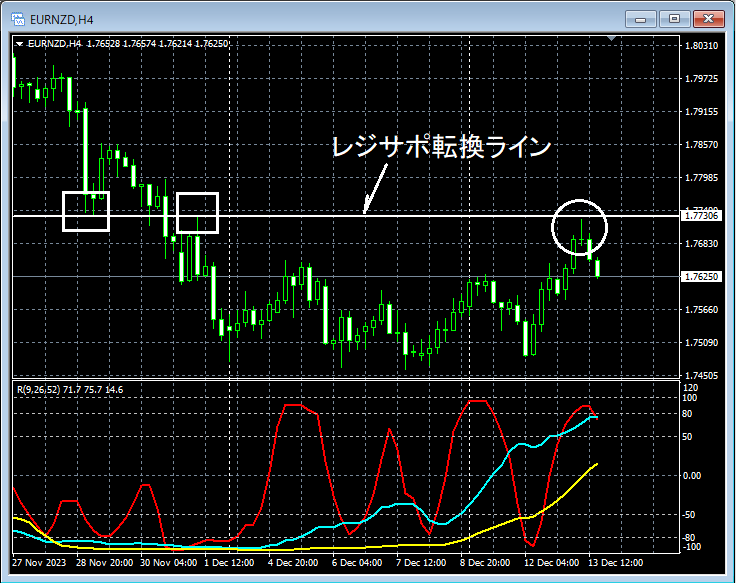
If you look at the area encircled in white on the 4-hour chart above,support/resistance reversal lineis approached again after returning to near it,pin bar (a candle with a long upper wick) is formed. It may not be surprising if it dips稍 below.
EURNZD 15-minute chart
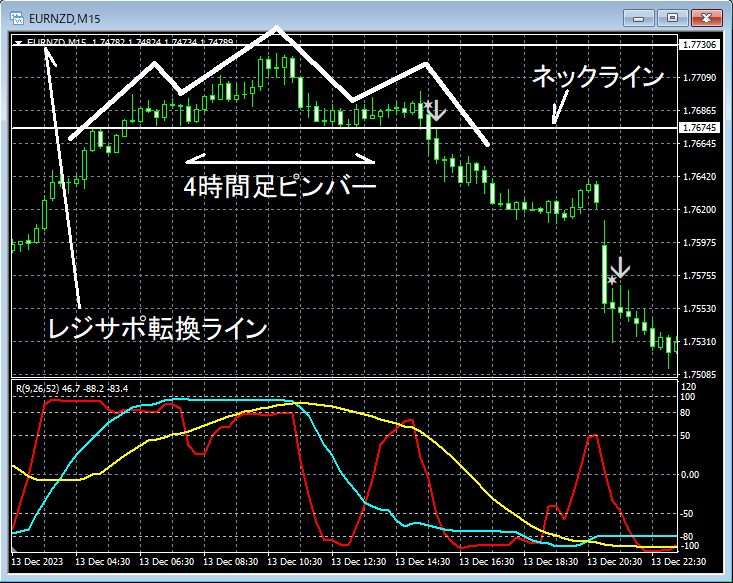
On the 15-minute chart above,head and shoulders’snecklinefalls below,R1R2S2 pullback sell signallights up, and then price declines steadily. Watching the chart,R1R2S2 pullback sell signallights up again.
From this example,a trading method that focuses on support/resistance reversal lines, pin bars, and head-and-shoulders, and its harmony with the R1R2S2 signalis evident.
Indicator that shines when combined with RCI【BODSOR・mBDSR】
Method and Case Study (PDF) ★GogoJungle AWARD2020 Winner★
A PDF file with 283 attachments is included.
Many of them are examples that have been distilled into a form where multiple lower timeframes are logically linked with the higher timeframe using 3-line RCI, and ultimately wait for the timing of a pullback buy or a retracement sell on the lower timeframe (the mBDSR signal)..
Also,many focus on capturing points where multiple entry reasons overlap..
In the explanations,more than 1,000 charts are used.

× ![]()


