

Fibonacci retracement, support-resistance reversal line, and pullback low with mBDSR (RCI two-filter) short-selling signal
Indicator that shines when combined with RCI【BODSOR・mBDSR】
Method and Case Studies (PDF) ★GogoJungle AWARD2020 Winner★
https://www.gogojungle.co.jp/tools/indicators/11836
Includes 283 PDF files.
Many of them are examples that describe how to logically link higher time frames and lower time frames using three RCI lines, gradually analyzing the conditions of multiple lower time frames, and ultimately waiting for timing to buy on dips or sell on rallies in the lower time frame (the mBDSR signal)..
Also,many focus on identifying points where multiple entry justifications overlap.
In the explanations,more than 1,000 chartsare used.

In a recent Investor Navi+ article,examples that illustrate the high compatibility between various trading methods and the mBDSR signalsare highlighted.
AUD/JPY 4-hour

Looking at the area circled in white on the 4-hour chart above, after a large drop,Fibonacci retracement 50%andthe lines that have historically functioned as resistance or supportcoincide, indicating a rise up to that area. It’s not unreasonable to expect a slight further decline.
AUD/JPY 30-minute
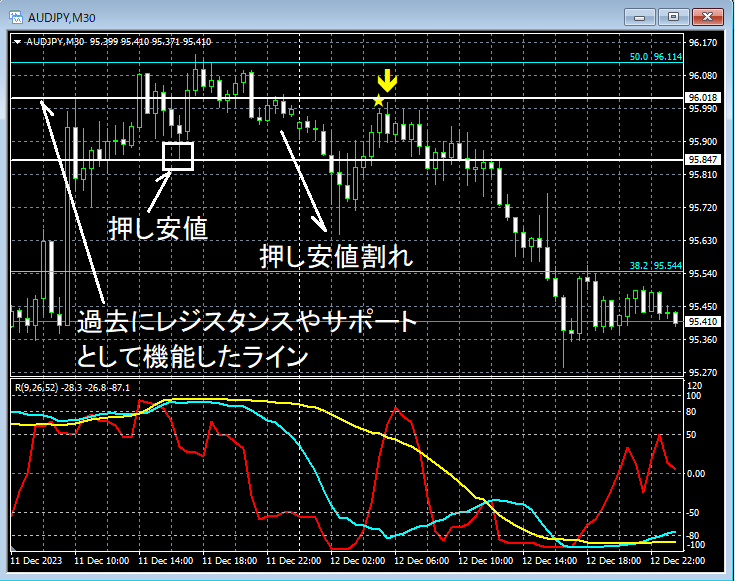
On the 30-minute chart above,swing low breakoutand the subsequent pullbackmBDSR (filters: RCI26 and RCI52) sell-on-rally signallight up, and prices then move downward steadily.
From this example,trading methods focusing on Fibonacci retracementsandtrading methods emphasizing Dow TheoryandmBDSR signalsshow a high degree of compatibility.
Indicator that shines when combined with RCI【BODSOR・mBDSR】
Method and Case Studies (PDF) ★GogoJungle AWARD2020 Winner★
https://www.gogojungle.co.jp/tools/indicators/11836
Includes 283 PDF files.
Many of them are examples that describe how to logically link higher time frames and lower time frames using three RCI lines, gradually analyzing the conditions of multiple lower time frames, and ultimately waiting for timing to buy on dips or sell on rallies in the lower time frame (the mBDSR signal)..
Also,many focus on identifying points where multiple entry justifications overlap.
In the explanations,more than 1,000 chartsare used.
× ![]()


