

Fibonacci Retracement and mBDSR (RCI 2-filter) Signals and Double Top
0
Indicator that shines in combination with RCI【BODSOR・mBDSR】
Methods and Case Studies (PDF) ★GogoJungle AWARD2020 Winner★
https://www.gogojungle.co.jp/tools/indicators/11836
The PDF file includes 283 items.
Many of them are examples that summarize how to logically link higher and lower timeframes using 3 RCI lines, sequentially considering the conditions of multiple lower timeframes, and finally waiting for a timing to buy on dips or sell on rallies in the lower timeframe (i.e., the mBDSR signal)..
Also,there are many that focus on capturing points where multiple entry reasons coincide..
In the explanations,over 1,000 chartsare used.

In recent Investor Navi+ articles,we show examples that illustrate the high compatibility between various trading methods and the mBDSR signals.
NZDJPY 4-hour chart
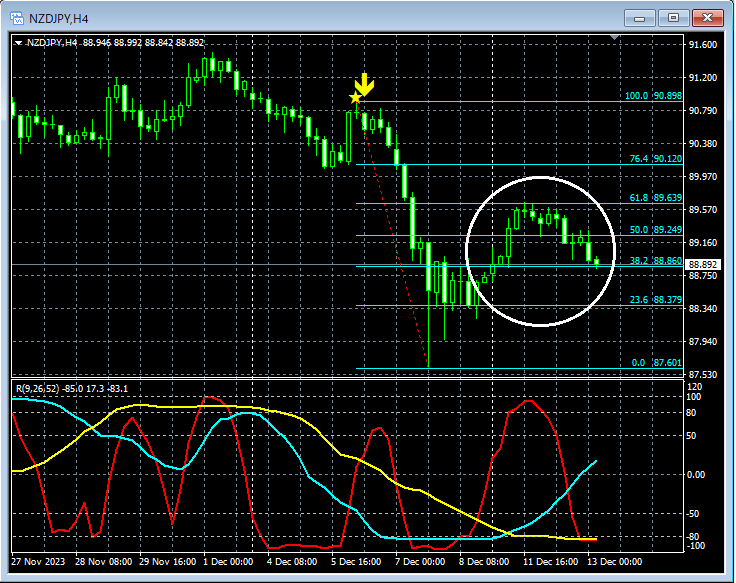
Looking at the area circled in white on the 4-hour chart above, after a deep drop,Fibonacci retracement 61.8%rises up to around that level. It may not be surprising to consider a possible slight pullback.
NZDJPY 1-hour chart
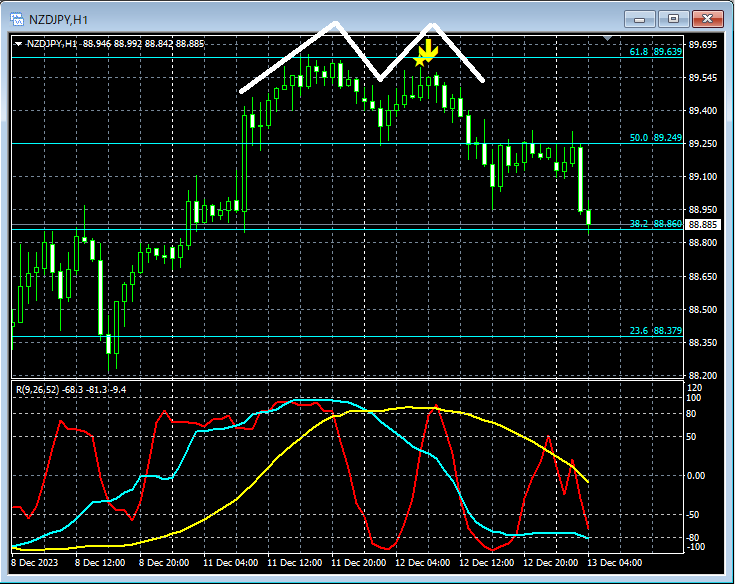
On the 1-hour chart above,Fibonacci retracement 61.8%rises to around that level and then turns down. And as it rises again,mBDSR (Filter: RCI26 and RCI52) sell signallights up, and subsequently the price declines steadily.
Also,a double topwhere the right-hand peak lights up a sell signal is notable.
From this example,a trading method focused on Fibonacci retracementanda trading method focused on double topsandthe signals of mBDSRshow strong compatibility.
Also, in this example,placing a stop loss just above the recent highand so on,allows for high risk-reward trades.
Indicator that shines in combination with RCI【BODSOR・mBDSR】
Methods and Case Studies (PDF) ★GogoJungle AWARD2020 Winner★
https://www.gogojungle.co.jp/tools/indicators/11836
The PDF file includes 283 items.
Many of them are examples that summarize how to logically link higher and lower timeframes using 3 RCI lines, sequentially considering the conditions of multiple lower timeframes, and finally waiting for a timing to buy on dips or sell on rallies in the lower timeframe (i.e., the mBDSR signal)..
Also,there are many that focus on capturing points where multiple entry reasons coincide..
In the explanations,over 1,000 chartsare used.
× ![]()


