

Contrarian signals in Bollinger Bands and the return-sell signal of mBDSR (RCI 2-band filter)
0
Indicator that demonstrates power in combination with RCI [BODSOR・mBDSR]
Method and Case Studies (PDF) ★GogoJungle AWARD2020 Winner★
https://www.gogojungle.co.jp/tools/indicators/11836
283 PDF files are included.
Many of them are about refining the approach to consider multiple lower-timeframe situations sequentially by logically linking higher and lower timeframes using three RCI lines, and ultimately waiting for the timing of pullbacks in lower timeframes (mBDSR signals) such as buy-the-dounce on dips or sell-into-retests..
Also,many focus on capturing points where multiple entry reasons overlap..
Descriptions usemore than 1,000 charts..

In recent Investor Navigator+ articles,examples that illustrate the high compatibility between various trading methods and mBDSR signalsare highlighted.
GBPCHF 4-hour
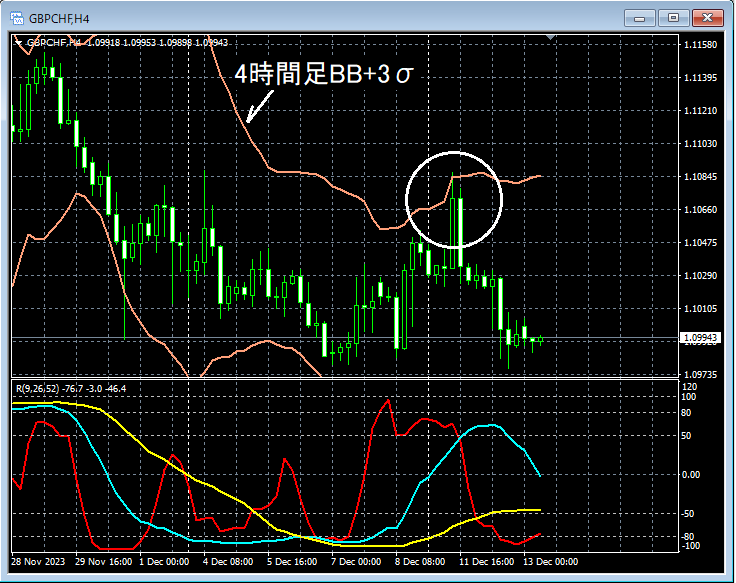
Looking at the area encircled in white at the top 4-hour chart,near the 4-hour Bollinger Band (±3σ)you can see it has risen toward that region. Here,Bollinger Bandsare the focus, so details are omitted, but$ there are lines that have functioned as support or resistance in the pastandoverlapped withweekly EMA21around which it might reasonably pull back a bit.
GBPCHF 5-minute
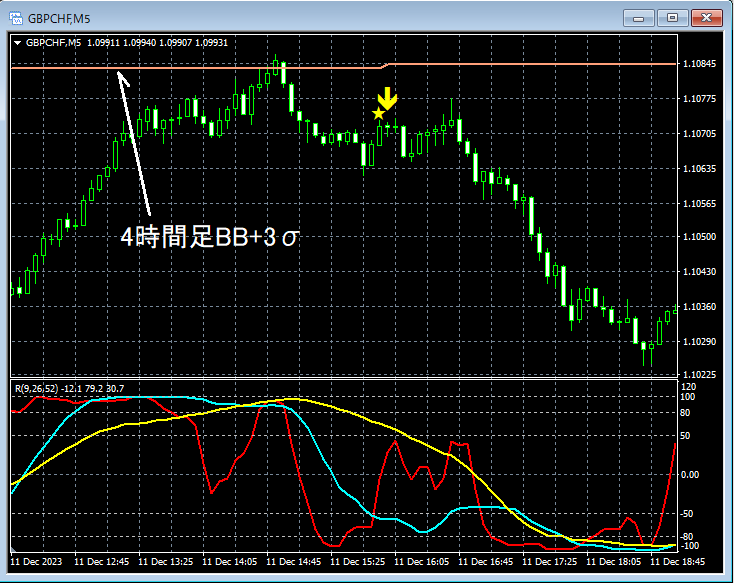
On the 5-minute chart above,4-hour Bollinger Band (±3σ)rises toward the vicinity and then turns into a slight pullback. AndmBDSR (Filter: RCI26 and RCI52) overbought/return signallights up, and afterward, price declines steadily without retracing the recent high.
From this example,the synergy between a Bollinger Bands-focused trading methodandmBDSR signalsbecomes apparent.
Indicator that shines in combination with RCI【BODSOR・mBDSR】
Method and Case Studies (PDF) ★GogoJungle AWARD2020 Winner★
https://www.gogojungle.co.jp/tools/indicators/11836
283 PDF files are included.
Many of them are about refining the approach to consider multiple lower-timeframe situations sequentially by logically linking higher and lower timeframes using three RCI lines, and ultimately waiting for the timing of pullbacks in lower timeframes (mBDSR signals) such as buy-the-dips or sell-into-retests..
Also,many focus on capturing points where multiple entry reasons overlap..
Descriptions usemore than 1,000 charts..
× ![]()


