

Fibonacci Retracement and the signs of mBDSR (RCI2-filtered by two lines) and double bottom
An indicator that shines when combined with RCI【BODSOR・mBDSR】
and methods ・ case studies (PDF) ★GogoJungle AWARD2020 winner★
https://www.gogojungle.co.jp/tools/indicators/11836
The PDF file comes with 283 items.
Most of them are compiled into examples that, by linking higher and lower timeframes logically using three RCI lines, examine the status of multiple lower timeframes sequentially and ultimately wait for a pullback buying or return selling timing on the lower timeframe (i.e., the mBDSR signal)..
Also,many focus on identifying points where multiple entry reasons coincide.
In the explanations,more than 1,000 chartsare used.

In recent Investment Navigator+ articles,we highlight examples that show the high compatibility between various trading methods and the mBDSR signal.
EUR/USD Daily
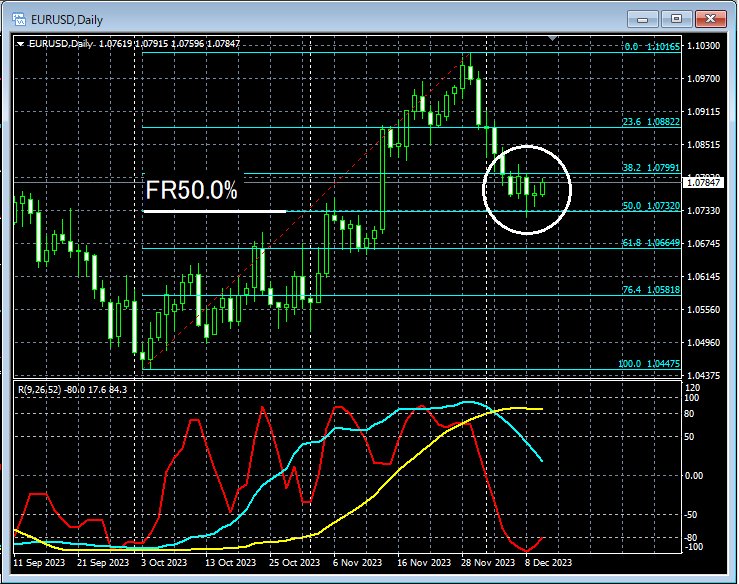
If you look at the area encircled in white on the daily chart above,Fibonacci Retracement 50.0%is reached nearby. It might not be surprising to consider a rebound possibility in this situation.
EUR/USD 1-Hour
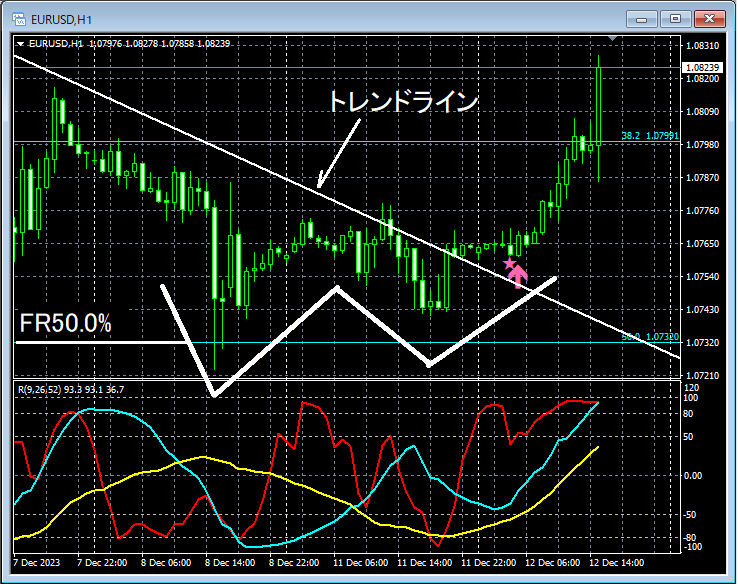
Looking at the 1-hour chart above,Fibonacci Retracement 50.0%is near a rebound, andtrend linehaving been broken upward,mBDSR (Filter: RCI26 and RCI52) pullback buying signallights up. When the signal lights, you may also notice that the right side of the double bottom may already be forming a valley. Since then, prices have risen steadily.
From this example,a trading method focused on Fibonacci Retracementanda trading method focused on the double bottomandthe mBDSR signalshow a strong compatibility.
An indicator that shines when combined with RCI【BODSOR・mBDSR】
and methods・case studies (PDF) ★GogoJungle AWARD2020 winner★
https://www.gogojungle.co.jp/tools/indicators/11836
The PDF file comes with 283 items.
Most of them are compiled into examples that, by linking higher and lower timeframes logically using three RCI lines, examine the status of multiple lower timeframes sequentially and ultimately wait for a pullback buying or return selling timing on the lower timeframe (i.e., the mBDSR signal)..
Also,many focus on identifying points where multiple entry reasons coincide.
In the explanations,more than 1,000 chartsare used.
× ![]()


