

Translate the following HTML to English, keep HTML format, do not use markdown code blocks or add line breaks, and decode entities before translating: Original: 上位足のRCI3本ラインが弱い形をしている場合の戻り売りについて Translation: About selling on rebounds when the higher-ti
An indicator that shines in combination with RCI【BODSOR・mBDSR】
and methods & case studies (PDF) ★GogoJungle AWARD2020 winner★
https://www.gogojungle.co.jp/tools/indicators/11836
A PDF file with 283 attachments is included.
Many of them are examples that have been distilled into a form where, by logically linking higher and lower timeframes using the three RCI lines, various conditions on multiple lower timeframes are sequentially considered, and ultimately waiting for delay-buying or pullback-selling timing on the lower timeframe (i.e., BODSOR signal)..
Also,many emphasize capturing points where multiple entry criteria overlap..
In the explanations,more than 1,000 chartsare used.

In a recent Investment Navigator+ article,we focus on examples that illustrate the strong compatibility between various trading methods and the mBDSR signal.
GBPAUD 1-hour chart
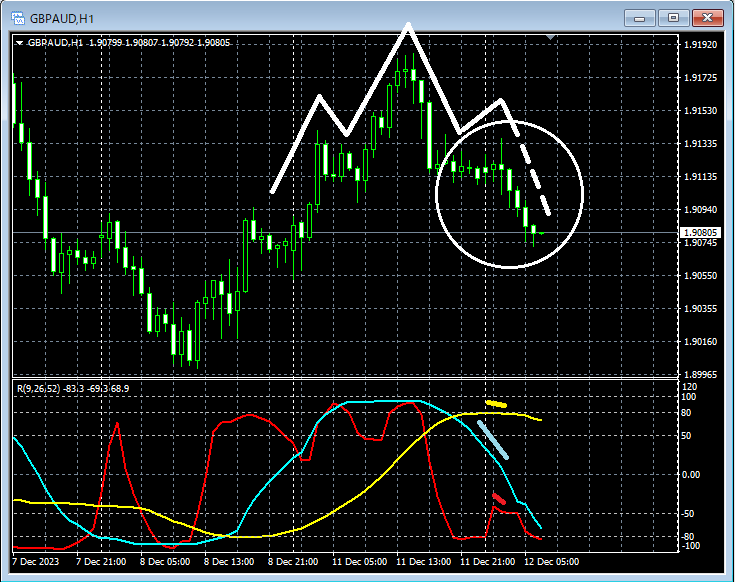
If you look at the area circled in white on the upper daily chart,the three RCI linesare aligned in a pattern that indicates a very weak downside. It wouldn’t be surprising if it moves a little lower. If it drops here,a head-and-shouldersmay form, which is something worth paying attention to.
GBPAUD 5-minute chart
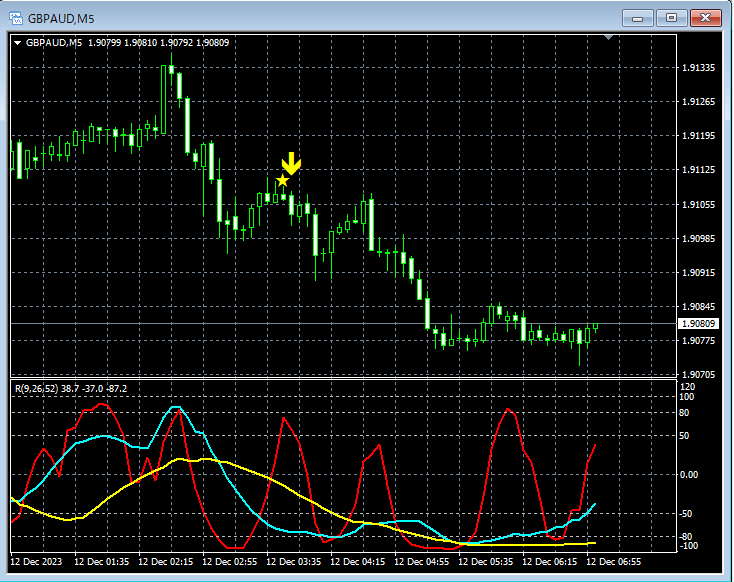
On the 5-minute chart above,mBDSR (Filter: RCI26 and RCI52) pullback-sell signallights up, and subsequently price declines steadily.
From this example,a trade method focused on head-and-shouldersandthe synergy withtheRCI three-lineandmBDSR signalsis evident.
An indicator that shines in combination with RCI【BODSOR・mBDSR】
and methods & case studies (PDF) ★GogoJungle AWARD2020 winner★
https://www.gogojungle.co.jp/tools/indicators/11836
A PDF file with 283 attachments is included.
Many of them are examples that have been distilled into a form where, by logically linking higher and lower timeframes using the three RCI lines, various conditions on multiple lower timeframes are sequentially considered, and ultimately waiting for delay-buying or pullback-selling timing on the lower timeframe (i.e., BODSOR signal).Also,
many emphasize capturing points where multiple entry criteria overlap..
In the explanations,more than 1,000 chartsare used.
× ![]()


