

Significant past lows and the short-selling signal on the return for mBDSR (RCI2 dual-filter)
Indicator that shines when combined with RCI: BODSOR・mBDSR
Methods and Case Studies (PDF) ★GogoJungle AWARD 2020 Winner★
https://www.gogojungle.co.jp/tools/indicators/11836
A PDF file with 283 attachments is provided.
Many of them are examples that elaborate a form where, by using three RCI lines to logically link higher and lower timeframes, the状況 of multiple lower timeframes are sequentially considered, ultimately waiting for a timing to buy on pullbacks or sell on rallies on the lower timeframe (the mBDSR signal)..
Also,many focus on capturing points where multiple entry reasons overlap..
In the explanations,more than 1,000 chartsare used.

In recent Investor Navigator+ articles,we showcase examples that highlight the strong compatibility between various trading methods and the mBDSR signals..
EUR/JPY Daily
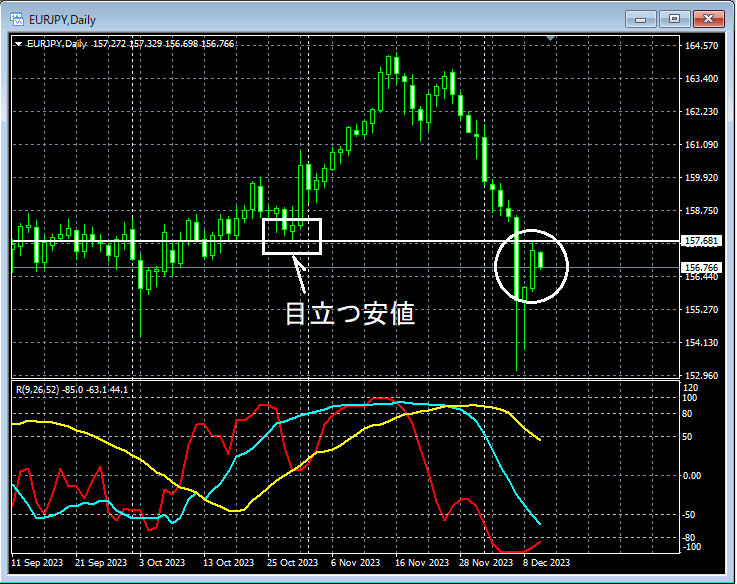
If you look at the area encircled by white on the daily above,you can see a notable lowaround which the price has risen. It may not be strange to expect a slight pullback.
EUR/JPY 30-minute
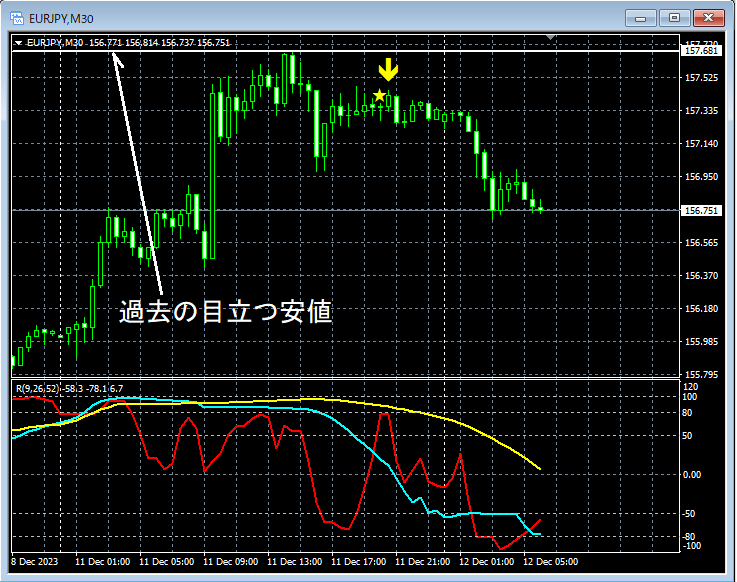
On the upper 30-minute chart,a line indicating a notable historic lowrises to and stalls near that area. In the subsequent rebound,mBDSR (Filters: RCI26 and RCI52) Sell signallights up, and price subsequently moves downward smoothly.
From this example,there is a strong synergy between a trade method focused on historic notable lowsandmBDSR signals.
Indicator that shines when combined with RCI: BODSOR・mBDSR
Methods and Case Studies (PDF) ★GogoJungle AWARD 2020 Winner★
https://www.gogojungle.co.jp/tools/indicators/11836
A PDF file with 283 attachments is provided.
Many of them are examples that elaborate a form where, by using three RCI lines to logically link higher and lower timeframes, the状況 of multiple lower timeframes are sequentially considered, ultimately waiting for a timing to buy on pullbacks or sell on rallies on the lower timeframe (the mBDSR signal)..
Also,many focus on capturing points where multiple entry reasons overlap..
In the explanations,more than 1,000 chartsare used.
× ![]()


