

Past lines that served as support and the return sell signal of mBDSR (RCI2 two-filter)
Indicator that shows power in combination with RCI【BODSOR・mBDSR】
Methods and case studies (PDF) ★GogoJungle AWARD 2020 Winner★
https://www.gogojungle.co.jp/tools/indicators/11836
The PDF file includes 283 items.
Many of them are examples that have been distilled into a form where, by using three RCI lines to logically link higher and lower timeframes, the状況 of multiple lower timeframes are sequentially examined, and finally wait for the timing to buy on dips or sell on retracements on the lower timeframe (i.e., mBDSR signals).It is.
Also,many focus on capturing points where multiple entry reasons overlap.
In the explanations,more than 1,000 chartsare used.

In recent Investor Navi+ articles,examples that show the high compatibility between various trading methods and mBDSR signalsare introduced focusing on those.
USD/JPY, 4-hour chart
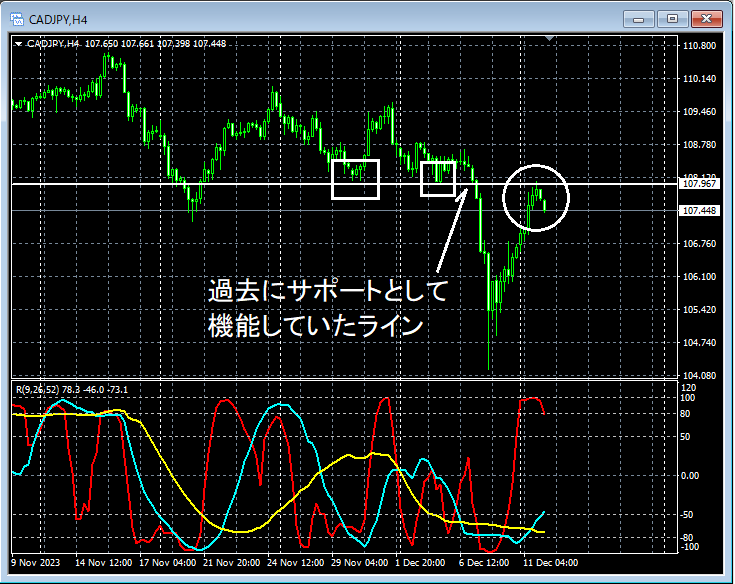
If you look at around the area boxed in white on the upper 4-hour chart,you can see that it rose toward a line that previously functioned as supportin the vicinity.Possible reversal from support/resistanceis not unlikely in this situation.
USD/JPY, 5-minute chart
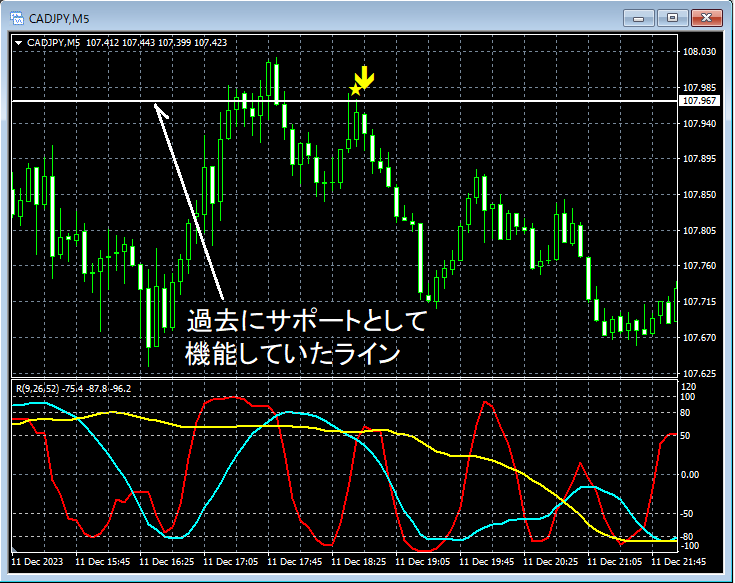
On the upper 5-minute chart,a line that previously functioned as supportrose toward the vicinity,mBDSR (filter: RCI26 and RCI52) sell signal on the retracelights up, and subsequently the price declines steadily.
From this example,the high compatibility between a trading method focusing on lines that previously acted as support andthemBDSR signalsis evident.
Indicator that shows power in combination with RCI【BODSOR・mBDSR】
Methods and case studies (PDF) ★GogoJungle AWARD 2020 Winner★
https://www.gogojungle.co.jp/tools/indicators/11836
The PDF file includes 283 items.
Many of them are examples that have been distilled into a form where, by using three RCI lines to logically link higher and lower timeframes, the状況 of multiple lower timeframes are sequentially examined, and finally wait for the timing to buy on dips or sell on retracements on the lower timeframe (i.e., mBDSR signals).It is.
Also,many focus on capturing points where multiple entry reasons overlap.
In the explanations,more than 1,000 chartsare used.
× ![]()


