

Moving Average and mBDSR (RCI two-band filter) overbought signal
0
Indicator that shines when combined with RCI: 【BODSOR・mBDSR】
and Methods & Case Studies (PDF) ★GogoJungle AWARD 2020 Winner★
https://www.gogojungle.co.jp/tools/indicators/11836
The PDF file includes 283 items.
Most of them are examples that have been distilled into a form where, by using three RCI lines to logically link higher and lower timeframes, the situations of multiple lower timeframes are examined sequentially, and ultimately the timing for a pullback buy or a pullback sell on the lower timeframe (=mBDSR signal) is waited for..
Also,many focus on capturing points where multiple entry reasons overlap..
In the explanations,more than 1,000 chartsare used.

In recent Investor Navi+ articles,we introduce mainly examples that show the high compatibility between various trading methodologies and the mBDSR signals..
Pound-Dollar 4-hour chart
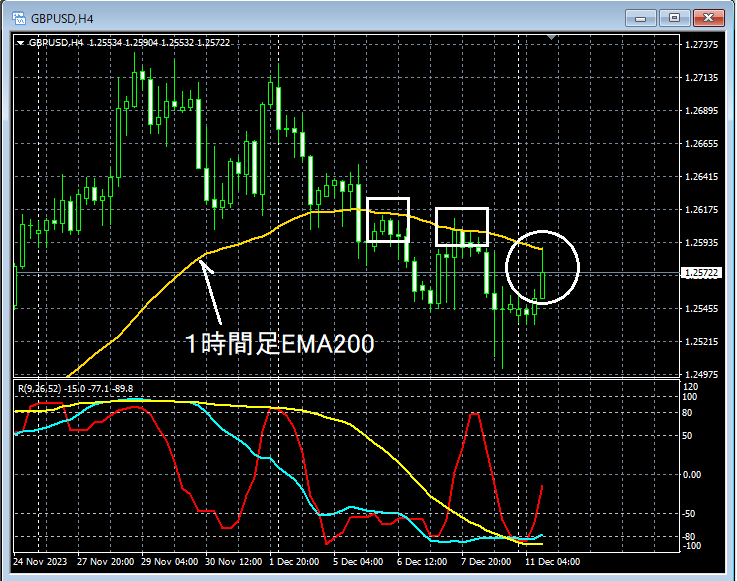
Looking at the area circled in white on the 4-hour chart above, it rises to near the1-hour EMA200which previously acted as resistance. It may not be strange to anticipate a slight pullback here.
Pound-Dollar 1-minute chart
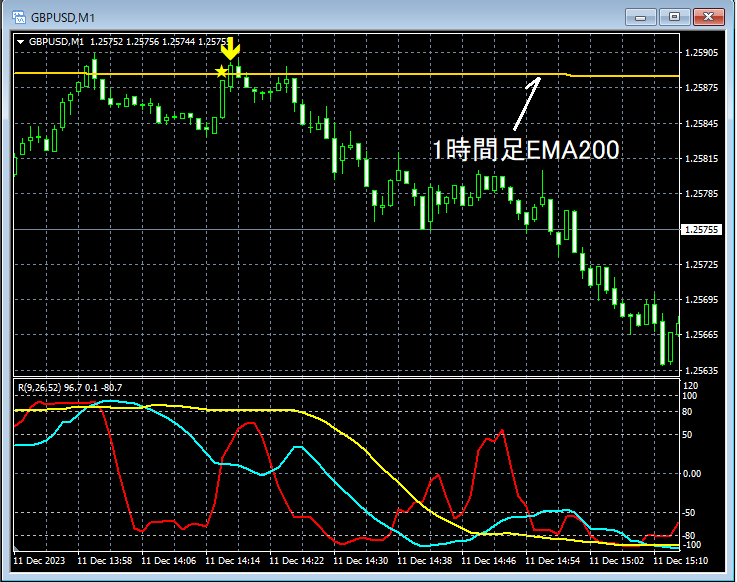
On the 5-minute chart above, it rises to near the1-hour EMA200where themBDSR (Filter: RCI26 and RCI52) pullback sell signallights up, and subsequently the price declines smoothly.
From this example,the high compatibility between moving-average-based trading methodsandmBDSR signalsis evident.
Indicator that shines when combined with RCI: 【BODSOR・mBDSR】
and Methods & Case Studies (PDF) ★GogoJungle AWARD 2020 Winner★
https://www.gogojungle.co.jp/tools/indicators/11836
The PDF file includes 283 items.
Most of them are examples that have been distilled into a form where, by using three RCI lines to logically link higher and lower timeframes, the situations of multiple lower timeframes are examined sequentially, and ultimately the timing for a pullback buy or a pullback sell on the lower timeframe (=mBDSR signal) is waited for..
Also,many focus on capturing points where multiple entry reasons overlap..
In the explanations,more than 1,000 chartsare used.
× ![]()


