

RCI3 main line, double bottom, head and shoulders, Elliott Wave, Fibonacci expansion, and mBDSR signals
0
Indicator that demonstrates power when combined with RCI【BODSOR・mBDSR】
and methods / case studies (PDF) ★GogoJungle AWARD2020 winner★
https://www.gogojungle.co.jp/tools/indicators/11836
A PDF file with 283 items is included.
Many of them are summarized as examples that logically link higher and lower timeframes using three RCI lines, sequentially considering the conditions of multiple lower timeframes, and ultimately waiting for the timing to buy on dips or sell on rallies on the lower timeframe (i.e., the mBDSR signal). This is the case.
Also,many focus on capturing points where multiple entry reasons overlapinfluence the decisions.
The explanations usemore than 1,000 chartsin total.

In a recent Investment Navigator+ article,we highlight the high compatibility between various trading methods and the mBDSR signalsthrough examples.
GBPCHF 5-minute chart
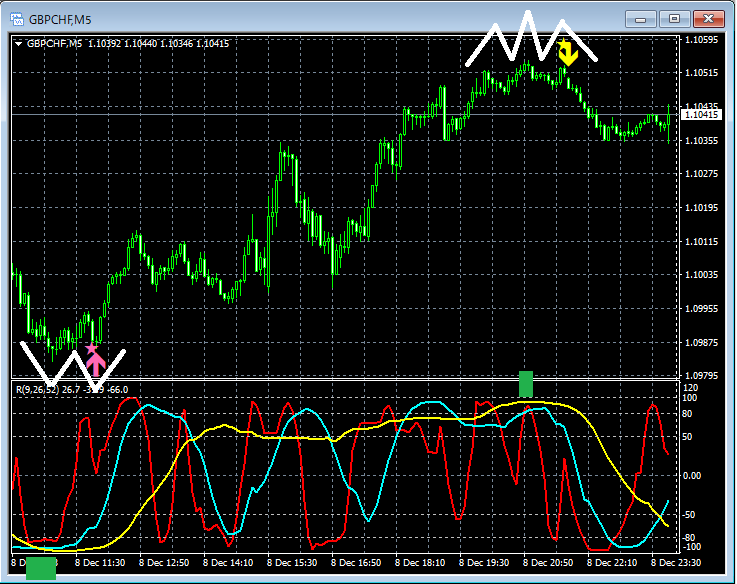
Looking at the 5-minute chart above, it shows the so-calledRCI triple bottomdropping to a low, then at the right-hand valley of the double bottommBDSR (filter: RCI26 and RCI52) dip-buy signallights up and rises.
Then, the so-calledRCI triple toprises to the peak, and at the right shoulder of the head-and-shoulders patternrises to the peak,mBDSR (filter: RCI26 and RCI52) pullback-sell signallights up and falls.
GBPCHF 5-minute chart
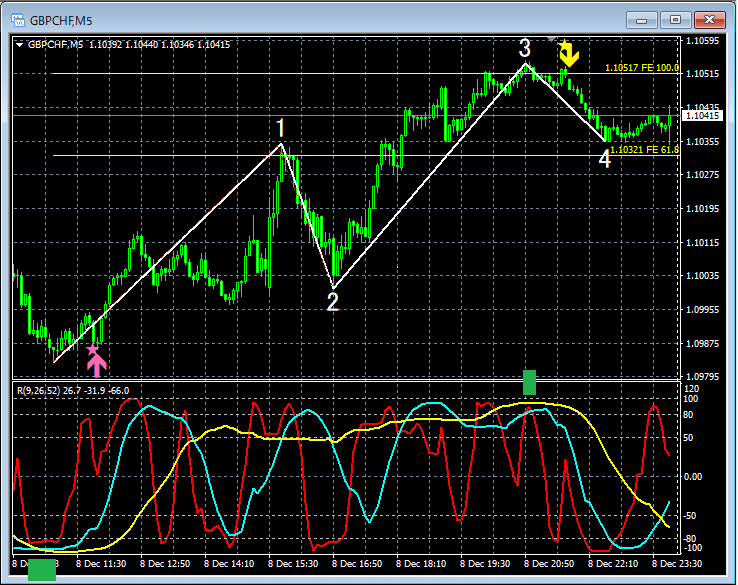
From a different perspective on the 5-minute chart, the rise from the so-calledRCI triple bottombegins theFirst rising waverally.
Then, the so-calledRCI triple topEnding the third rising wave. Note that the end of the third rising wavealmost coincides with the 100% Fibonacci extension line.
From this example,Elliott Waveandtrading methods focusing on Fibonacci extensionsandtrading methods focusing on double bottomsandtrading methods focusing on head-and-shouldersandRCI three-lineandmBDSR signalsshow strong compatibility.
Indicator that demonstrates power when combined with RCI【BODSOR・mBDSR】
and methods / case studies (PDF) ★GogoJungle AWARD2020 winner★
https://www.gogojungle.co.jp/tools/indicators/11836
A PDF file with 283 items is included.
Many of them are summarized as examples that logically link higher and lower timeframes using three RCI lines, sequentially considering the conditions of multiple lower timeframes, and ultimately waiting for the timing to buy on dips or sell on rallies on the lower timeframe (i.e., the mBDSR signal).
Also,many focus on capturing points where multiple entry reasons overlapinfluence the decisions.
The explanations usemore than 1,000 chartsin total.
× ![]()


